. 2013 Jun 28;8(6):e67263.
doi: 10.1371/journal.pone.0067263. Print 2013.

A2E induces IL-1ß production in retinal pigment epithelial cells via the NLRP3 inflammasome

Affiliations

A2E induces IL-1ß production in retinal pigment epithelial cells via the NLRP3 inflammasome

Owen A Anderson et al. PLoS One. .

Abstract

Aims: With ageing extracellular material is deposited in Bruch's membrane, as drusen. Lipofuscin is deposited in retinal pigment epithelial cells. Both of these changes are associated with age related macular degeneration, a disease now believed to involve chronic inflammation at the retinal-choroidal interface. We hypothesise that these molecules may act as danger signals, causing the production of inflammatory chemokines and cytokines by the retinal pigment epithelium, via activation of pattern recognition receptors.

Methods: ARPE-19 cells were stimulated in vitro with the following reported components of drusen: amyloid-ß (1-42), Carboxyethylpyrrole (CEP) modified proteins (CEP-HSA), Nε-(Carboxymethyl)lysine (CML) modified proteins and aggregated vitronectin. The cells were also stimulated with the major fluorophore of lipofuscin: N-retinylidene-N-retinylethanolamine (A2E). Inflammatory chemokine and cytokine production was assessed using Multiplex assays and ELISA. The mechanistic evaluation of the NLRP3 inflammasome pathway was assessed in a stepwise fashion.

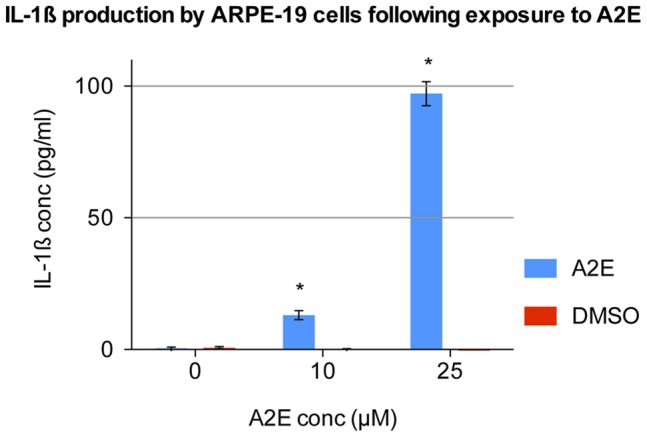
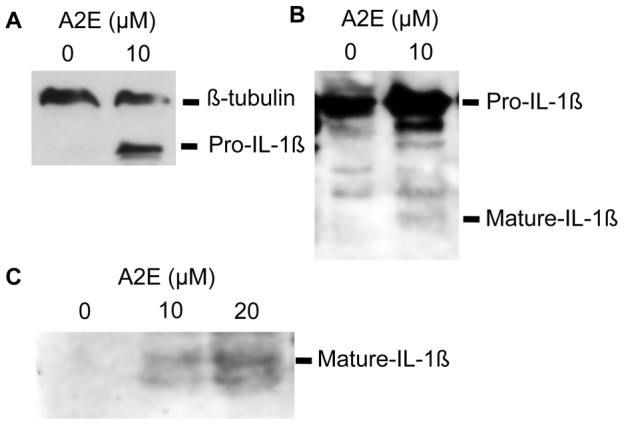
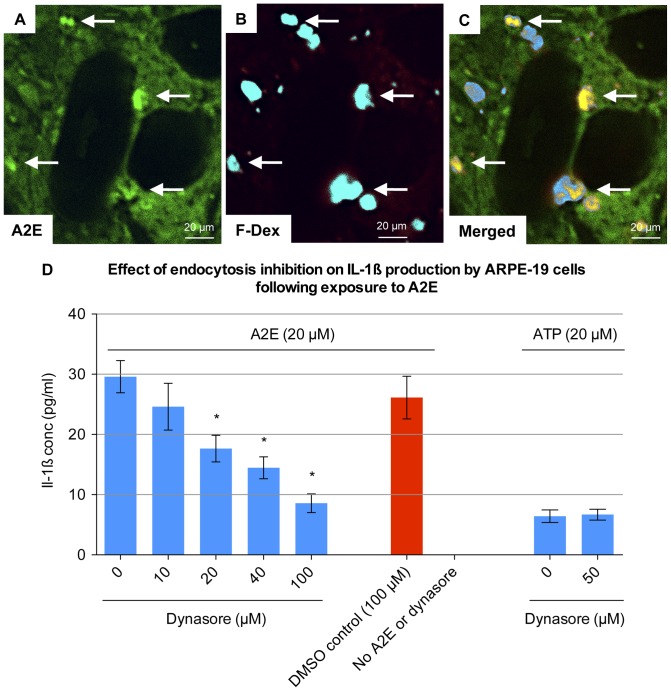
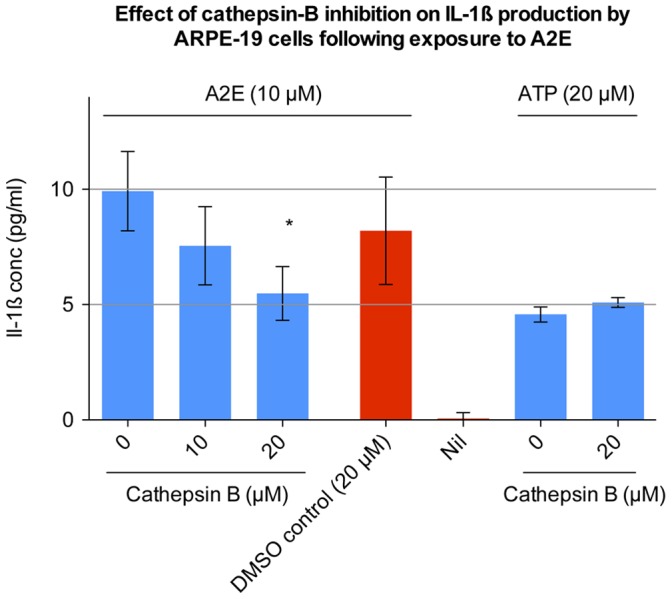
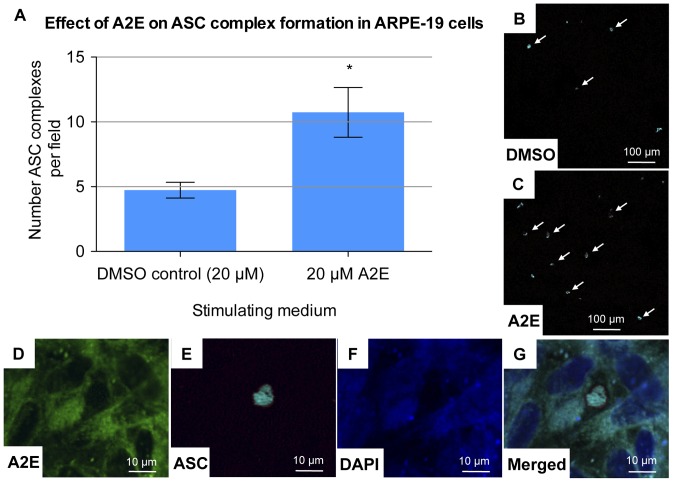
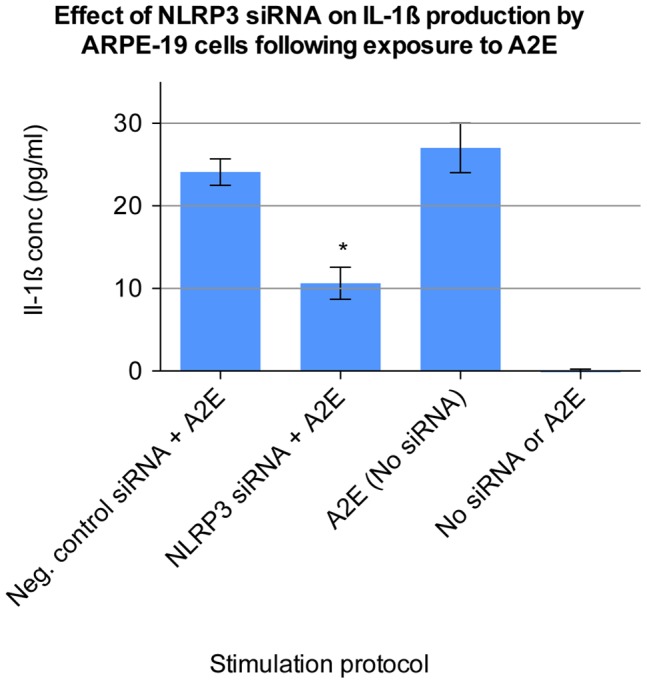
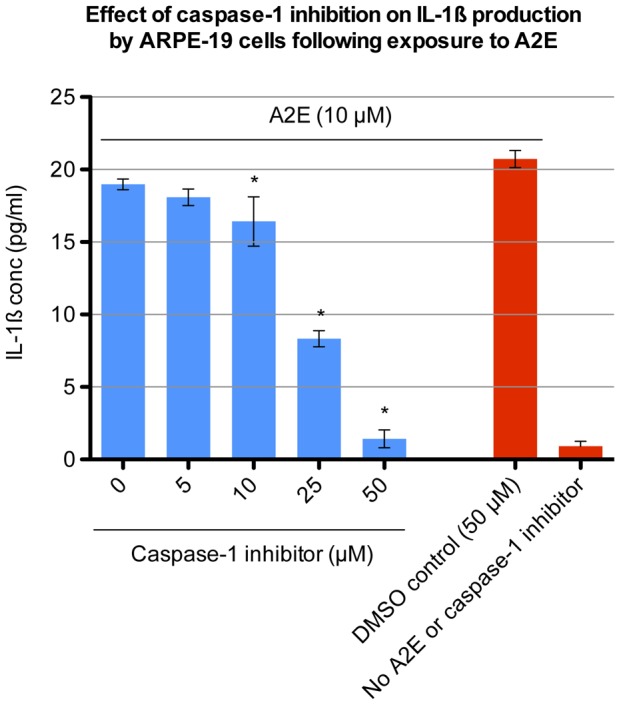
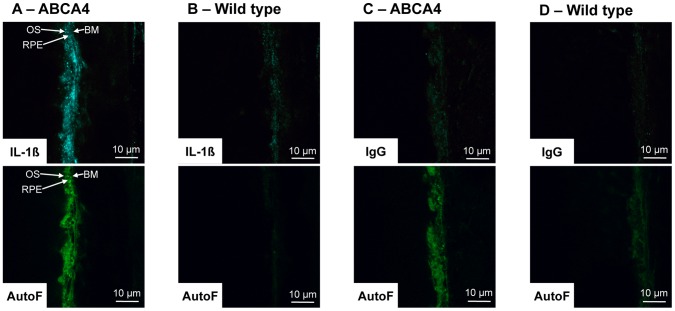
Results: Of all the molecules tested only A2E induced inflammatory chemokine and cytokine production. 25 µM A2E induced the production of significantly increased levels of the chemokines IL-8, MCP-1, MCG and MIP-1α, the cytokines IL-1ß, IL-2, IL-6, and TNF-α, and the protein VEGF-A. The release of IL-1ß was studied further, and was determined to be due to NLRP3 inflammasome activation. The pathway of activation involved endocytosis of A2E, and the three inflammasome components NLRP3, ASC and activated caspase-1. Immunohistochemical staining of ABCA4 knockout mice, which show progressive accumulation of A2E levels with age, showed increased amounts of IL-1ß proximal to the retinal pigment epithelium.

Conclusions: A2E has the ability to stimulate inflammatory chemokine and cytokine production by RPE cells. The pattern recognition receptor NLRP3 is involved in this process. This provides further evidence for the link between A2E, inflammation, and the pathogenesis of AMD. It also supports the recent discovery of NLRP3 inflammasome activation in AMD.


Conflict of interest statement

Competing Interests: The authors have declared that no competing interests exist.

Figures

Figure 1
Figure 1. IL-1ß production by ARPE-19 cells following exposure to A2E.
ARPE-19 cells were prestimulated with IL-1α and then treated with 0, 10 and 25 µM A2E for a period of 24 hours. IL-1ß levels were recorded in the supernatant via ELISA. A2E stock was dissolved in DMSO. Therefore DMSO at the same concentration, but without A2E, was used as a negative control. Four separate wells were stimulated with each concentration (n  = 4). Error bars represent standard deviation. (*) 10 and 25 µM A2E significantly increased IL-1ß production (p<0.0001, one-way ANOVA).
Figure 2
Figure 2. Upregulation of pro-IL-1ß and conversion to mature IL-1ß following exposure to A2E.
(A) Western blot showing upregulation of pro-IL-1ß following stimulation with A2E. ARPE-19 cells were prestimulated with IL-1α and then treated with 0 and 10 µM A2E for a period of 24 hours. Cells were lysed (on ice in the presence of a protease and phosphatase inhibitor) and equal amounts of lysate (assessed via BCA protein assay) underwent western blotting. Membranes were probed with anti-human IL-1ß, which detects both the pro and mature form of the cytokine. Staining with ß-tubulin was used to confirm that comparable amounts of lysate were used. (B) Western blot of cell lysate showing both upregulation of pro-IL-1ß, with some conversion to mature IL-1ß, following stimulation with A2E. (C) Western blot of cell culture supernatant showing increasing amounts of mature IL-1ß in the supernatant, with increasing concentration of A2E.
Figure 3
Figure 3. Endocytosis of A2E by ARPE-19 cells.
(A–C) ARPE-19 cells were incubated with 20 µM A2E and 10 µM fixable 10 kDa Alexa Fluor 647 dextran for 6 hours. Cells were fixed with 4% PFA for 10 min, but not permeabilised, and viewed via confocal microscopy. Autofluorescence of A2E was viewed at an excitation frequency of 490 nm, while the Alexa Fluor dextran was viewed at an excitation frequency of 650 nm. There was no significant bleeding of A2E autofluorescence into the emission range of Alexa Fluor 647 dextran (data not shown). A2E colocalised with Alexa Fluor dextran in intracellular vesicles (arrows). (D) ARPE-19 cells were pre-stimulated for 48 hours with 1000 pg/ml IL-1α and then incubated with 20 µM A2E for 24 hours in the presence of 0, 10, 20, 40 and 100 µM Dynasore. Dynasore stock was dissolved in DMSO. Therefore DMSO at the same concentration, but without Dynasore, was used as a negative control. Four separate wells were stimulated with each concentration (n  = 4). IL-1ß levels were recorded in the supernatant via ELISA. Cells were also treated with 20 µM ATP in the presence of 0 and 50 µM Dynasore. Error bars represent standard deviation. (*) 20, 40 and 100 µM of Dynasore significantly inhibited IL-1ß production (p<0.0001, one-way ANOVA).
Figure 4
Figure 4. Effect of cathepsin-B inhibition on IL-1ß production by ARPE-19 cells following exposure to A2E.
Undifferentiated ARPE-19 cells were pre-stimulated for 48 hours with 1000 pg/ml IL-1α. During the last 24 hours of pre-stimulation, 0, 10 or 20 µM of cathepsin-B inhibitor was added. The medium was then exchanged for serum free DMEM containing 10 µM A2E, along with the cathepsin-B inhibitor (at the same concentration as during the preceding pre-stimulation step). After 24 hours the cell culture supernatant was collected and processed using ELISA. Cathepsin-B inhibitor stock was dissolved in DMSO. Therefore DMSO at the same concentration, but without cathepsin-B inhibitor, was used as a negative control. The effect of cathepsin-B inhibition on ATP (20 µM) induced IL-1ß production was also assessed. Eight separate wells were stimulated with each concentration (n  = 8). Error bars represent standard deviation. (*) 20 µM of Cathepsin-B inhibitor significantly inhibited IL-1ß production as compared to the DMSO control (p<0.0001, one-way ANOVA).
Figure 5
Figure 5. Effect of A2E on ASC complex formation in ARPE-19 cells.
To assess ASC activity in the presence of A2E, ARPE-19 cells, cultured on laminin coated glass coverslips, were incubated for 6 hours with 20 µM A2E. A2E stock was dissolved in DMSO. Therefore DMSO at the same concentration, but without A2E, was used as a negative control. Coverslips were then removed and immediately stained. The primary antibody used was a mouse anti-human ASC monoclonal antibody at 1 µg/ml. An Alexa Fluor 647 goat anti-mouse IgG was used as a secondary antibody. A masked examiner counted the number of ASC complexes in five randomly assigned fields per slide. A mean count per field was then calculated for each slide. This was performed for three slides per group (n  = 3). Error bars represent standard deviation. (A) Number of ASC complexes per field for 20 µM A2E and for the DMSO control. (*) 20 µM of A2E significantly increased the number of ASC complexes visualized (p = 0.0067, one-way ANOVA). (B–C) Low magnification view of ASC complexes (some are highlighted with arrows). An increased number of complexes were seen per field, in the presence of A2E. (D–G) High magnification view of a cytoplasmic ASC complex (far-red). A2E shows autofluorescence in both the green and blue spectrum. Hence the DAPI nuclear stain is blurred by A2E autofluorescence. There is no bleeding of A2E autofluorescence into the ASC far-red spectrum.
Figure 6
Figure 6. Effect of NLRP3 siRNA on IL-1ß production by ARPE-19 cells following exposure to A2E.
Undifferentiated ARPE-19 cells were seeded onto 96-well plates and after 24 hours transfected for 72 hours with a 50 nM concentration of Silencer Select NLRP3 siRNA (Hs00918085_m1, Applied Biosystems Ltd). 50 nM of Silencer Select Negative Control No. 1 siRNA was also used. 1000 pg/ml Il-1α was added to the transfection media during this period. The cells were then stimulated for 24 hours with 10 µM A2E. Cell culture supernatant was collected and processed using ELISA. Cells were also incubated with transfection reagent alone, in the absence of any siRNA, and then stimulated with either A2E in DMEM, or DMEM alone. Eight separate wells were stimulated under each condition (n  = 8). Error bars represent standard deviation. (*) NLRP3 siRNA significantly inhibited IL-1ß production as compared to negative control siRNA (p<0.0001, one-way ANOVA).
Figure 7
Figure 7. Effect of caspase-1 inhibition on IL-1ß production by ARPE-19 cells following exposure to A2E.
Undifferentiated ARPE-19 cells were cultured in 96-well plates. The cells were pre-stimulated for 48 hours with 1000 pg/ml IL-1α and then incubated with 10 µM A2E for 24 hours in the presence of 0, 5, 10, 25, 50 µM of caspase-1 inhibitor. The caspase-1 inhibitor stock was dissolved in DMSO. Therefore DMSO at the same concentration, but without caspase-1 inhibitor, was used as a negative control. IL-1ß levels were recorded in the supernatant via ELISA. Four separate wells were stimulated with each concentration (n  = 4). Error bars represent standard deviation. (*) 10, 25 and 50 µM of caspase-1 inhibitor significantly inhibited IL-1ß production (p<0.0001, one-way ANOVA).
Figure 8
Figure 8. ABCA4 knockout mice demonstrate increased retinal pigment epithelial IL-1ß staining.
Sections were stained for IL-1ß. Both matched wild type mice (129S2/SvHsd) and isotype matched IgG were used as negative controls. (A & B) Upper micrographs show IL-1ß staining of retinal pigment epithelium for ABCA4 knockout mice and SVHSD control mice. Increased IL-1ß staining is seen in the ABCA4 knockout mice compared to the wild type mice. Lower micrographs show RPE autofluorescence (AutoF - absorption 490 nm, emission 520 nm). Higher autoflourescence of the ABCA4 knockout mice is in keeping with increased levels of lipofuscin. (C & D) Upper micrographs show control IgG staining (primary antibody) of ABCA4 knockout mice and wild type mice. No significant staining is seen in both samples. Lower micrographs show RPE autofluorescence. Abbreviations: BM – Bruch’s membrene, OS – Outer segments, RPE – Retinal pigment epithelium.

References

    1. Klein R, Klein BE, Jenson SC, Meuer SM (1997) The five-year incidence and progression of age-related maculopathy: the Beaver Dam Eye Study. Ophthalmology 104: 7–21. - PubMed
    1. Rahmani B, Tielsch JM, Katz J, Gottsch J, Quigley H, et al. (1996) The cause-specific prevalence of visual impairment in an urban population. The Baltimore Eye Survey. Ophthalmology 103: 1721–1726. - PubMed
    1. Ambati J, Ambati BK, Yoo SH, Ianchulev S, Adamis AP (2003) Age-related macular degeneration: etiology, pathogenesis, and therapeutic strategies. Surv Ophthalmol 48: 257–293. - PubMed
    1. Rosenfeld PJ, Brown DM, Heier JS, Boyer DS, Kaiser PK, et al. (2006) Ranibizumab for neovascular age-related macular degeneration. N Engl J Med 355: 1419–1431. - PubMed
    1. Feeney-Burns L, Hilderbrand ES, Eldridge S (1984) Aging human RPE: morphometric analysis of macular, equatorial, and peripheral cells. Investigative Ophthalmology Visual Science 25: 195–200. - PubMed

Publication types

MeSH terms