. 2013 Jun 20;8(6):e67441.
doi: 10.1371/journal.pone.0067441. Print 2013.

Stage-regulated GFP Expression in Trypanosoma cruzi: applications from host-parasite interactions to drug screening

Affiliations

Stage-regulated GFP Expression in Trypanosoma cruzi: applications from host-parasite interactions to drug screening

Rafael Luis Kessler et al. PLoS One. .

Abstract

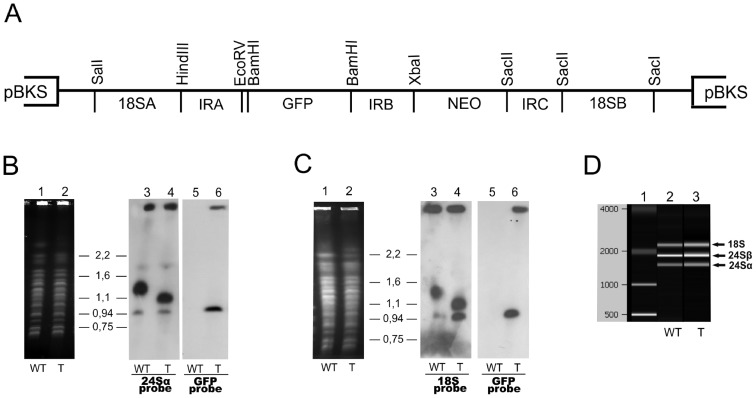
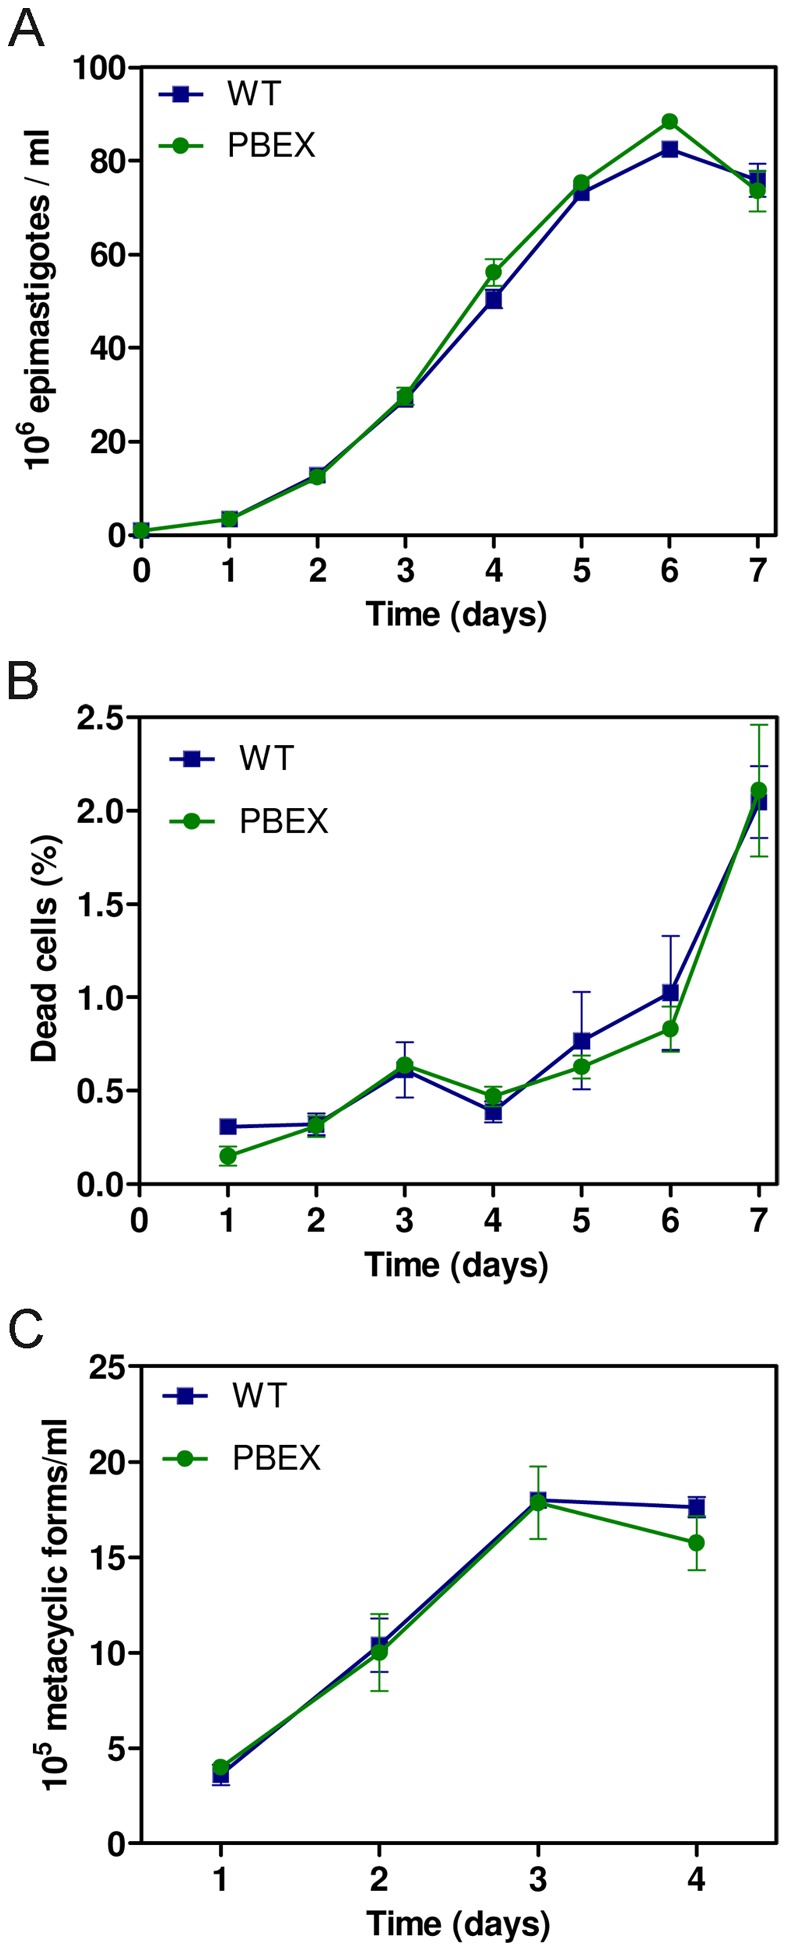
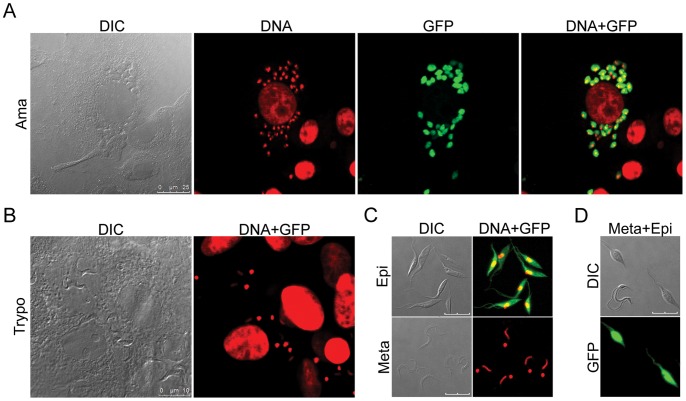
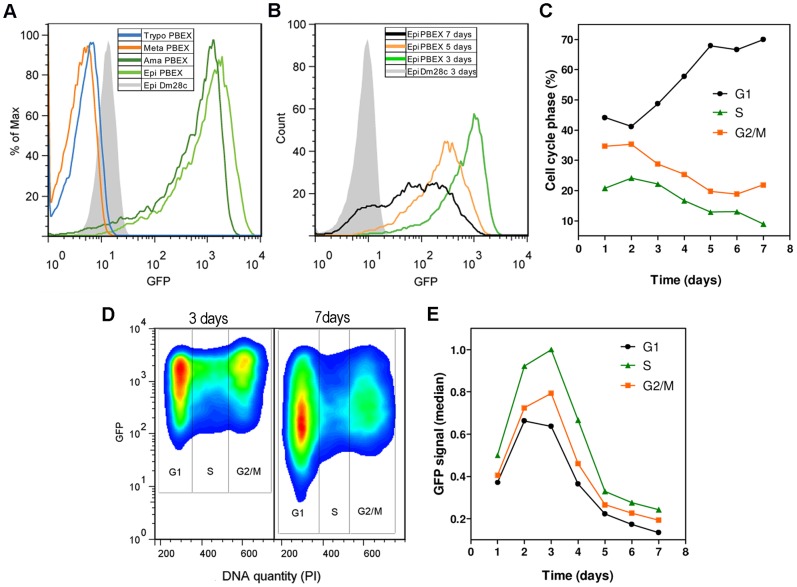
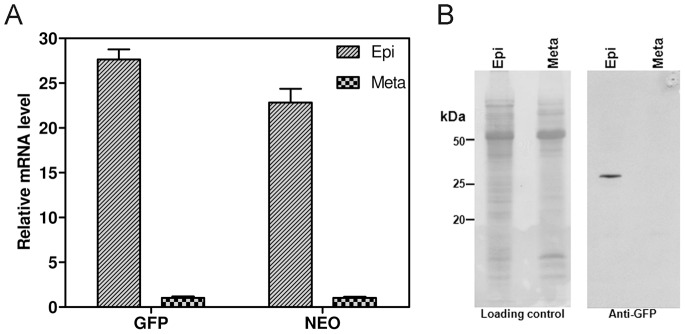
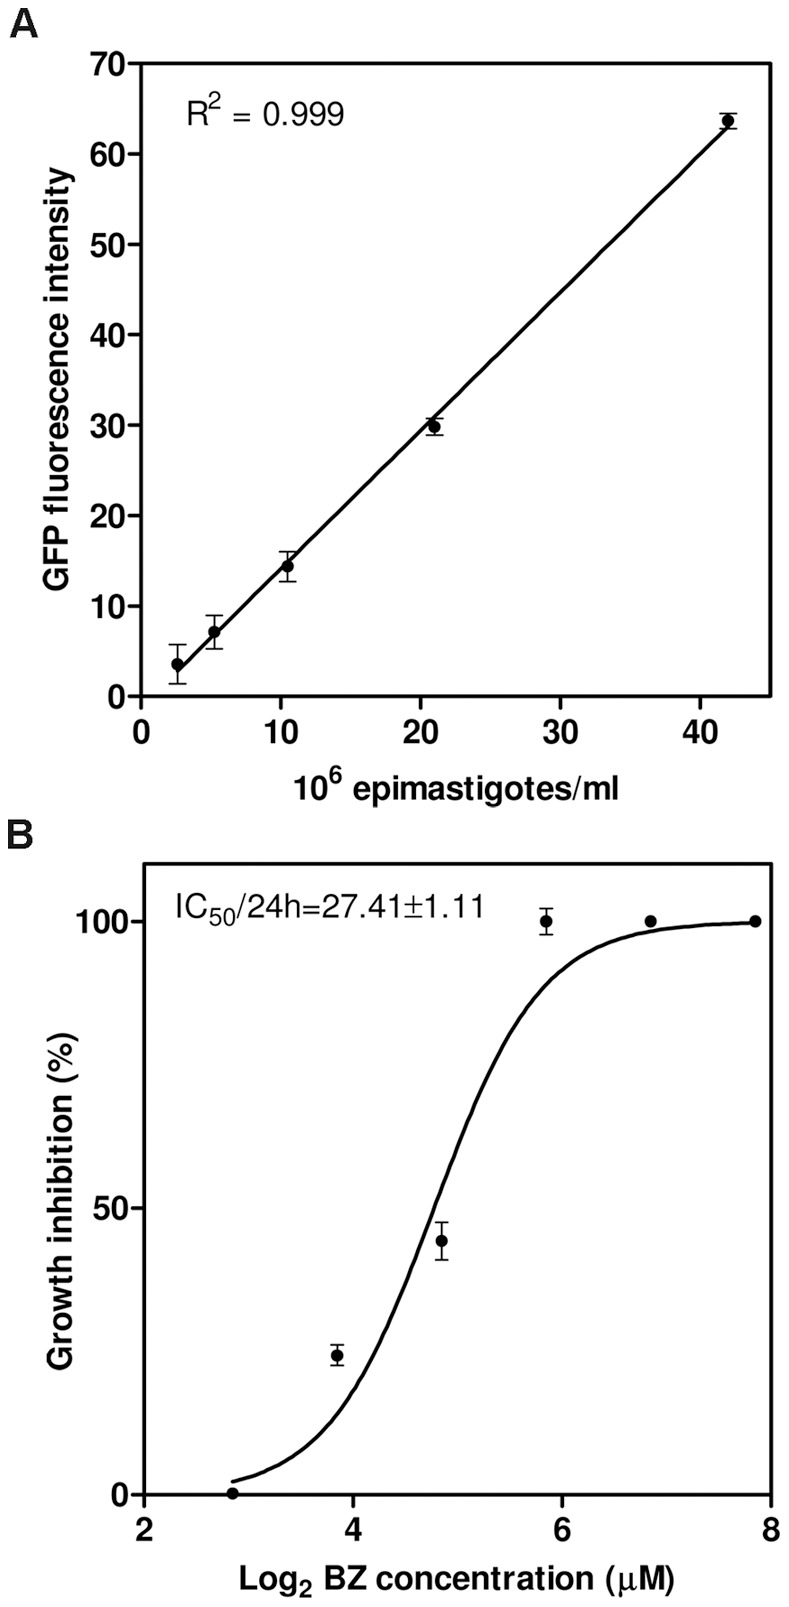
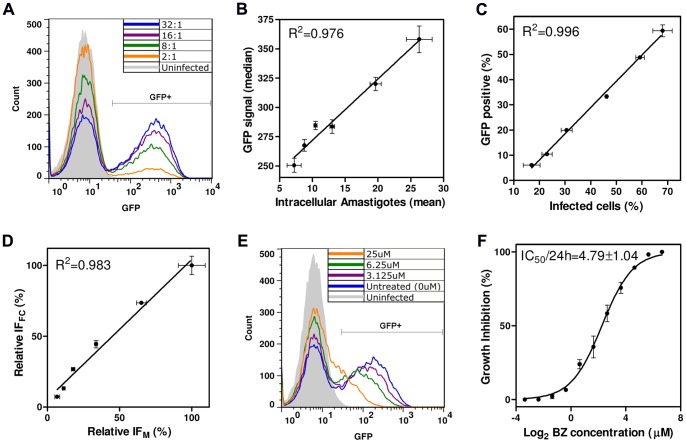
Trypanosoma cruzi is the etiological agent of Chagas disease, an illness that affects about 10 million people, mostly in South America, for which there is no effective treatment or vaccine. In this context, transgenic parasites expressing reporter genes are interesting tools for investigating parasite biology and host-parasite interactions, with a view to developing new strategies for disease prevention and treatment. We describe here the construction of a stably transfected fluorescent T. cruzi clone in which the GFP gene is integrated into the chromosome carrying the ribosomal cistron in T. cruzi Dm28c. This fluorescent T. cruzi produces detectable amounts of GFP only at replicative stages (epimastigote and amastigote), consistent with the larger amounts of GFP mRNA detected in these forms than in the non replicative trypomastigote stages. The fluorescence signal was also strongly correlated with the total number of parasites in T. cruzi cultures, providing a simple and rapid means of determining the growth inhibitory dose of anti-T.cruzi drugs in epimastigotes, by fluorometric microplate screening, and in amastigotes, by the flow cytometric quantification of T. cruzi-infected Vero cells. This fluorescent T. cruzi clone is, thus, an interesting tool for unbiased detection of the proliferating stages of the parasite, with multiple applications in the genetic analysis of T. cruzi, including analyses of host-parasite interactions, gene expression regulation and drug development.


Conflict of interest statement

Competing Interests: The authors have declared that no competing interests exist.

Figures

Figure 1
Figure 1. Integration of the green fluorescent protein (GFP) gene following parasite transfection.
(A) Schematic representation of the pBEX/GFP construct. The expression vector has the Trypanosoma cruzi 18S ribosomal sequences flanking the intergenic regions between the alpha and beta tubulin genes that provides the spliced leader and polyadenylation sites for the GFP mRNA and the neomycin resistance gene (NeoR) used as a selectable marker. (B and C) Southern-blot analyses of transfected parasites. High-molecular weight DNA, isolated from wild-type (WT) epimastigotes of T. cruzi Dm28c (B1 and C1) and Dm28c transfected (T) with pBEX/GFP (fluorescent epimastigotes) (B2 and C2) were separated by PFGE and stained with ethidium bromide. The bands were transferred to nylon membranes and hybridized with [32P]-labeled probes corresponding to the 24S alpha rDNA (B3 and B4), 18S rDNA (C3 and C4) and GFP (B5, B6, C5 and C6) sequences. (D) Total RNA was isolated from wild-type epimastigotes and pBEX fluorescent epimastigotes and analyzed with an Agilent 2100 Bioanalyzer; data are displayed as a densitometry plot (gel-like image). In this analysis, the fluorescent parasites display a rRNA band pattern (D3) similar to that of the wild-type parasites (D2), suggesting that the mobility shift of the 1.4 Mbp chromosome did not affect the production of functional rRNA molecules. D1 =  molecular weight marker.
Figure 2
Figure 2. GFP expression does not affect the growth, viability and metacyclogenesis of T. cruzi.
(A) Growth curves of wild-type (Dm28c) and pBEX/GFP cultured epimastigotes showing no significant difference in growth; cell density was determined with an electronic particle counter (Z2 Coulter Particle Count and Size Analyzer, Beckman Coulter®). (B) Cell viability analysis of epimastigote cultures by vital dye (propidium iodide - PI) staining and flow cytometry quantification of PI-positive cells. (C) Metacyclogenesis efficiency in wild-type and pBEX/GFP cultures; after metacyclogenesis induction (details in methods) the density of metacyclic forms in the culture supernatant was obtained daily, by direct counting in a Neubauer chamber. For all plots, each experimental point represents the mean and standard deviation of triplicate experiments.
Figure 3
Figure 3. Fluorescence confocal microscopy assessing GFP expression in various stages of T. cruzi pBEX/GFP.
(A) Amastigote-infected Vero cells after 48 h of trypomastigote infection. (B) Trypomastigotes produced after 4 days of Vero cell infection. (C) Epimastigotes in the exponential growth phase (upper photos) and purified metacyclic forms (lower photos). (D) Mixture of live epimastigotes and metacyclic forms, showing the absence of GFP fluorescence in trypomastigotes. DIC: differential interference contrast; DNA: staining of DNA with Hoechst 33342 dye (for better visualization in overlay images, Hoechst fluorescence has been artificially converted to red); GFP: fluorescence of GFP; DNA+GFP: overlay images of Hoechst and GFP fluorescence. Bars correspond to 10 µm, except in A (25 µm).
Figure 4
Figure 4. Flow cytometry analysis of GFP fluorescence in all major stages of the T. cruzi pBEX/GFP life cycle.
(A) Overlay histograms of GFP fluorescence in various forms of T. cruzi (specified in the box). Note that only the replicative forms (epimastigotes and amastigotes) of the parasite display GFP fluorescence. % of Max is a normalization of the total number of events in the overlaid histograms; each sample is scaled to the percentage of its maximum signal. (B) Overlay histograms of GFP fluorescence after various numbers of days of epimastigote culture; exponential growth phase (3 days), stationary phase (5 days) and late stationary phase with the presence of metacyclic forms (7 days). Cell culture was initiated with 1×10⁶ cells ml−1 (as in Figure 2A). (C) Percentage of epimastigotes in each phase of the cell cycle (G1, S and G2/M), as determined by flow cytometric analysis of DNA content with PI staining, during epimastigote culture. (D) Flow cytometry density plot showing the correlation of GFP fluorescence with the cell cycle of epimastigotes of T. cruzi pBEX/GFP after 3 days and 7 days of culture (indicated above the plot). (E) Median GFP fluorescence in each phase of the cell cycle during the culture of pBEX/GFP epimastigotes. The intensity of GFP expression is higher in cultures displaying active replication of DNA (S phase) and is highly dependent on culture time. In the plots, wild-type epimastigotes (Dm28c) were used as a negative control for the normalization of GFP fluorescence level. The results shown in (C), (D) and (E) are representative of duplicate experiments with coefficients of variation of less than 5%.
Figure 5
Figure 5. RT-qPCR and western-blot analysis of GFP expression.
(A) mRNA levels for the GFP and NEO genes in epimastigotes and metacyclic trypomastigotes, as determined by RT-qPCR and shown as relative mRNA levels, with the metacyclic level fixed at 1. (B) Western blot of GFP in epimastigotes (Epi) and metacyclic trypomastigotes (Meta). The “Loading control” (left) is the Ponceau-stained membrane before incubation with anti-GFP antibody (right). Note the detection of GFP only in epimastigotes.
Figure 6
Figure 6. Fluorometric assay of parasite density.
(A) Correlation between cell density and the GFP fluorescence intensity obtained with a microplate reader. Epimastigotes were diluted to known densities in LIT medium in triplicate before fluorescence determinations; the total cell number and fluorescence intensity were strongly linearly correlated (R2 = 0.999). (B) Calculation of the benznidazole inhibitory dose by the microplate fluorometric method. Each experimental point represents the mean and standard deviation for quintuplicate drug exposures. The IC50/24 h is indicated on the graph.
Figure 7
Figure 7. Flow cytometry assay for intracellular anti-amastigote activity.
(A) Overlaid histograms of GFP fluorescence in Vero cells infected with various ratios of trypomastigotes/Vero cells (indicated within the graph) together with a non infected control. The GFP+ Vero cells were considered to be infected with amastigotes. (B) Correlation between the mean number of amastigotes per Vero cell (obtained by manual counting on Giemsa-stained smears) and the median GFP signal of GFP+ Vero cells (obtained in flow cytometry experiments). Each experimental point corresponds to Vero infection with a different ratio of trypomastigotes/Vero cells (as in (A)). Note that the results of the two methods of intracellular amastigote quantification display a strong linear correlation (R2 = 0.976). (C) Correlation between the % infected cells obtained by microscopy and flow cytometry (R2 = 0.996). (D) Comparison of the infection indices in Vero cells obtained by microscopy (IFM) and flow cytometry (IFFC), to estimate intracellular amastigote growth. Data are shown as a percentage of maximum growth. The results of the two methods are highly correlated (R2 = 0.983). For details of IFM and IFFC calculation, see Materials and Methods. (E) Overlaid histograms of infected Vero cells (10 trypomastigotes/Vero cell) treated with different doses of benznidazole (indicated within the graph) together with uninfected and untreated controls. (F) Calculation of the benznidazole IC50/24 h (indicated within the graph) by the flow cytometry method. Each experimental point represents the mean and standard deviation of duplicate drug exposures.

References

    1. Anonymous (2010) Chagas disease (American trypanosomiasis) fact sheet (revised in June 2010). Wkly Epidemiol Rec 85: 334–336. - PubMed
    1. Coura JR, Dias JC (2009) Epidemiology, control and surveillance of Chagas disease: 100 years after its discovery. Mem Inst Oswaldo Cruz 104 Suppl 131–40. - PubMed
    1. Tyler KM, Engman DM (2001) The life cycle of Trypanosoma cruzi revisited. Int J Parasitol 31: 472–481. - PubMed
    1. De Souza W (2002) Basic cell biology of Trypanosoma cruzi . Curr Pharm Des 8: 269–285. - PubMed
    1. Clayton CE (2002) Life without transcriptional control? From fly to man and back again. EMBO J 21: 1881–1888. - PMC - PubMed

Publication types

MeSH terms

LinkOut - more resources