The quantitative genetic architecture of the bold-shy continuum in zebrafish, Danio rerio
- PMID: 23840902
- PMCID: PMC3698077
- DOI: 10.1371/journal.pone.0068828
The quantitative genetic architecture of the bold-shy continuum in zebrafish, Danio rerio
Abstract
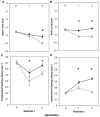
In studies of consistent individual differences (personality) along the bold-shy continuum, a pattern of behavioral correlations frequently emerges: individuals towards the bold end of the continuum are more likely to utilize risky habitat, approach potential predators, and feed under risky conditions. Here, we address the hypothesis that observed phenotypic correlations among component behaviors of the bold-shy continuum are a result of underlying genetic correlations (quantitative genetic architecture). We used a replicated three-generation pedigree of zebrafish (Danio rerio) to study three putative components of the bold-shy continuum: horizontal position, swim level, and feeding latency. We detected significant narrow-sense heritabilities as well as significant genetic and phenotypic correlations among all three behaviors, such that fish selected for swimming at the front of the tank swam closer to the observer, swam higher in the water column, and fed more quickly than fish selected for swimming at the back of the tank. Further, the lines varied in their initial open field behavior (swim level and activity level). The quantitative genetic architecture of the bold-shy continuum indicates that the multivariate behavioral phenotype characteristic of a "bold" personality type may be a result of correlated evolution via underlying genetic correlations.
Conflict of interest statement
Figures


References
-
- Réale D, Reader SM, Sol D, McDougall PT, Dingemanse NJ (2007) Integrating animal temperament within ecology and evolution. Biol Rev 82: 291–318. doi:10.1111/j.1469-185X.2007.00010.x. PubMed: 17437562. - DOI - PubMed
-
- Wilson DS, Clark AB, Coleman K, Dearstyne T (1994) Shyness and boldness in humans and other animals. Trends Ecol Evol 9: 442–446. doi:10.1016/0169-5347(94)90134-1. PubMed: 21236920. - DOI - PubMed
-
- Conrad JL, Weinersmith KL, Brodin T, Saltz JB, Sih A (2011) Behavioural syndromes in fishes: a review with implications for ecology and fisheries management. J Fish Biol 78: 395–435. doi:10.1111/j.1095-8649.2010.02874.x. PubMed: 21284626. - DOI - PubMed
-
- Sih A, Bell AM, Johnson JC, Ziemba RE (2004) Behavioral syndromes: an integrative overiew. Q Rev Biol 79: 241–277. doi:10.1086/422893. PubMed: 15529965. - DOI - PubMed
-
- Schluter D (1996) Adaptive radiation along genetic lines of least resistance. Evolution: 1766–1774. - PubMed
Publication types
MeSH terms
Grants and funding
LinkOut - more resources
Full Text Sources
Other Literature Sources

