

A systematic analysis of the peripheral and CNS effects of systemic LPS, IL-1β, [corrected] TNF-α and IL-6 challenges in C57BL/6 mice
- PMID: 23840908
- PMCID: PMC3698075
- DOI: 10.1371/journal.pone.0069123
A systematic analysis of the peripheral and CNS effects of systemic LPS, IL-1β, [corrected] TNF-α and IL-6 challenges in C57BL/6 mice
Erratum in
- PLoS One. 2013;8(12). doi:10.1371/annotation/90c76048-2edd-4315-8404-4d9d8cbd411e
Abstract
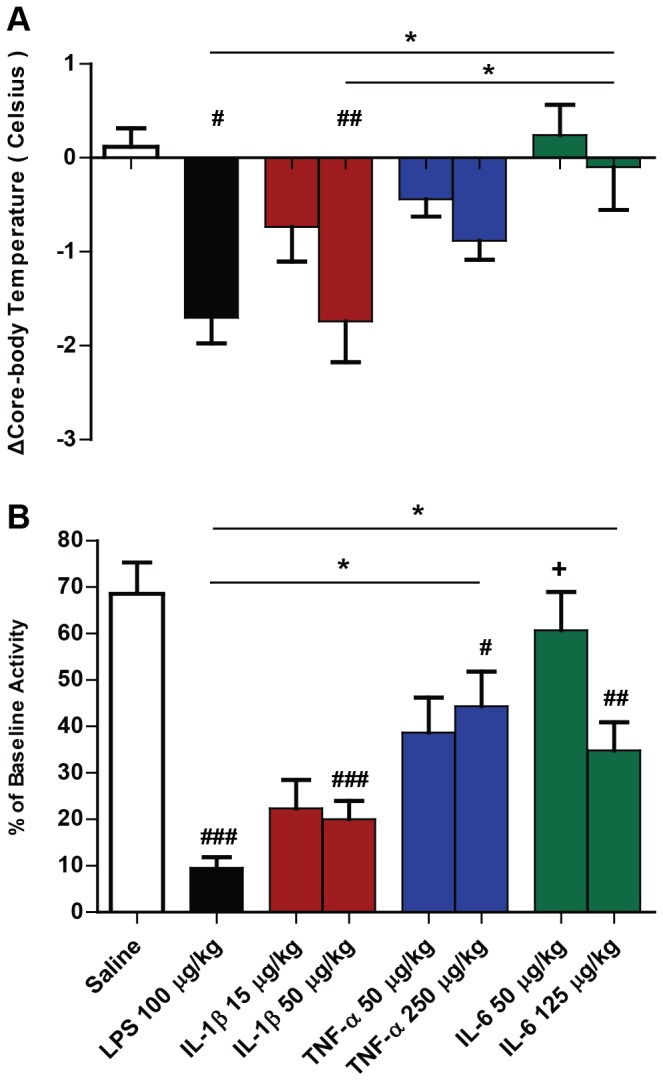
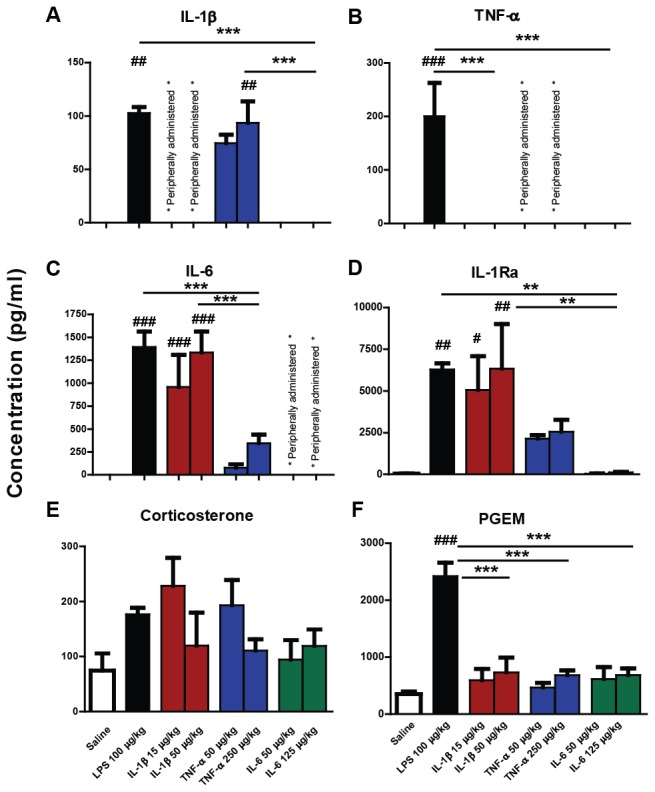
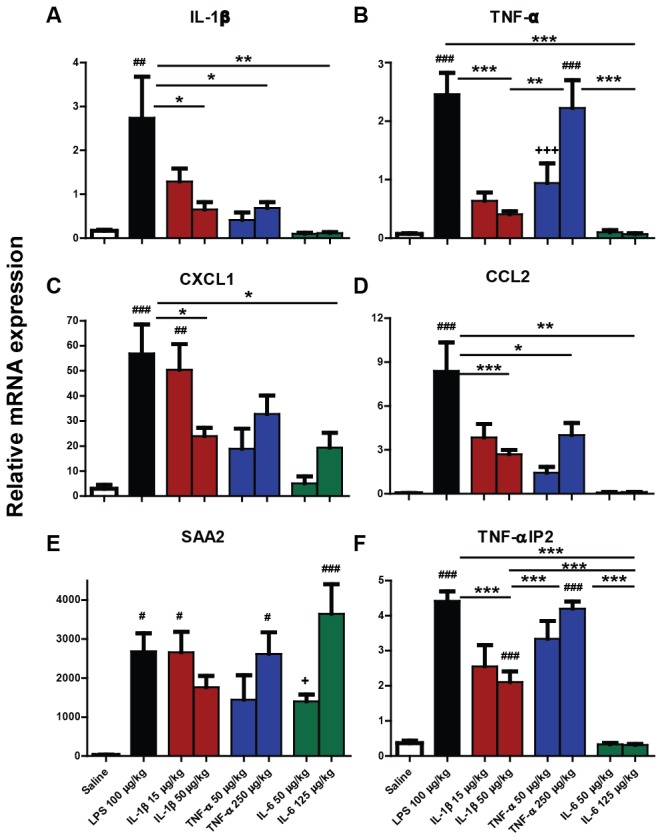
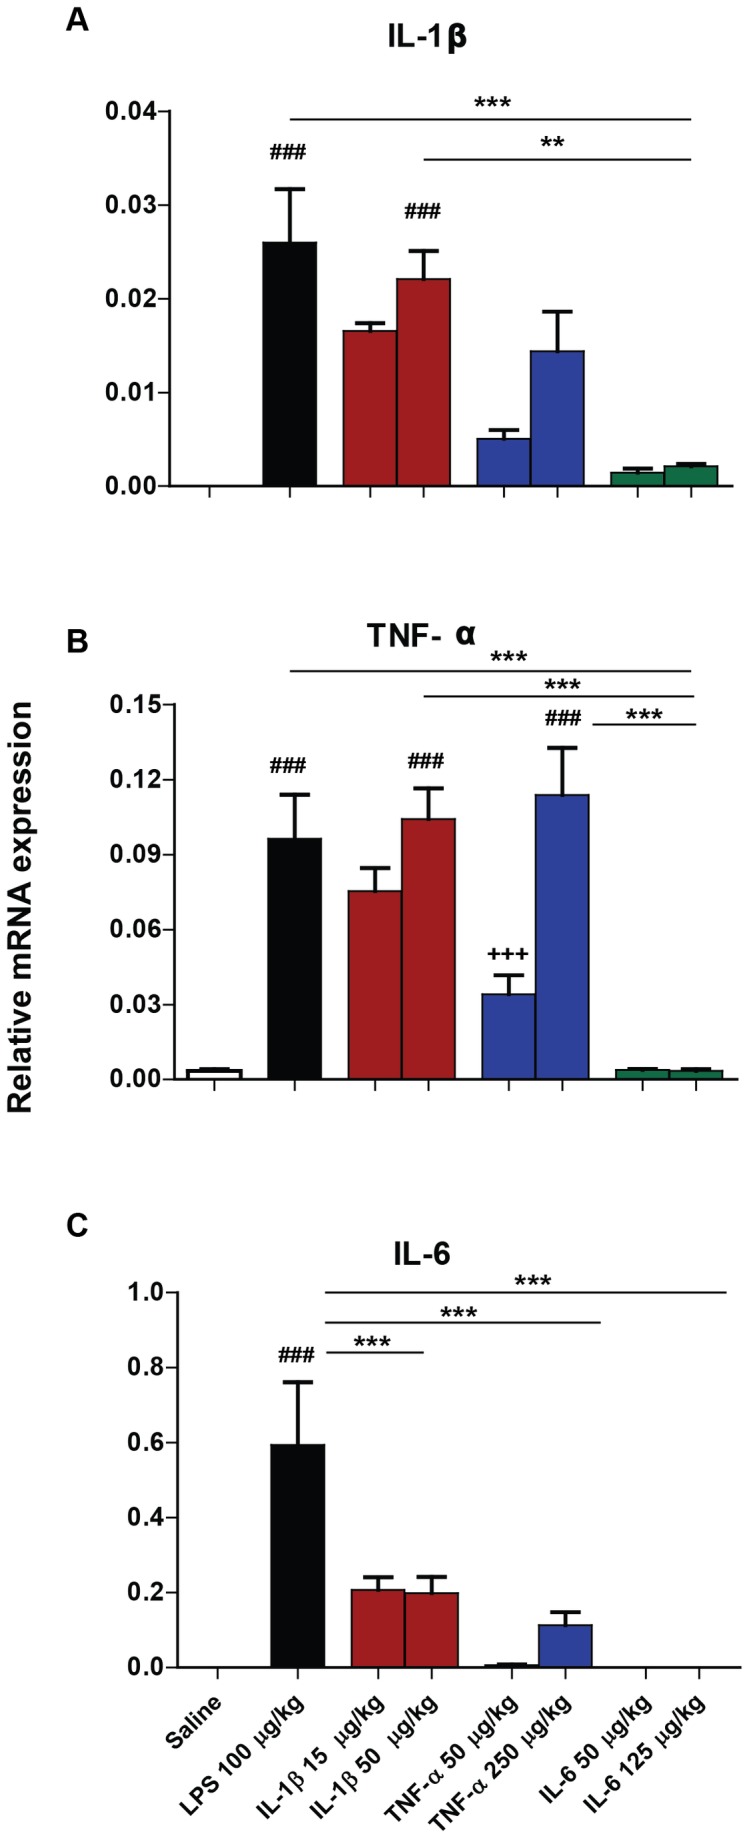
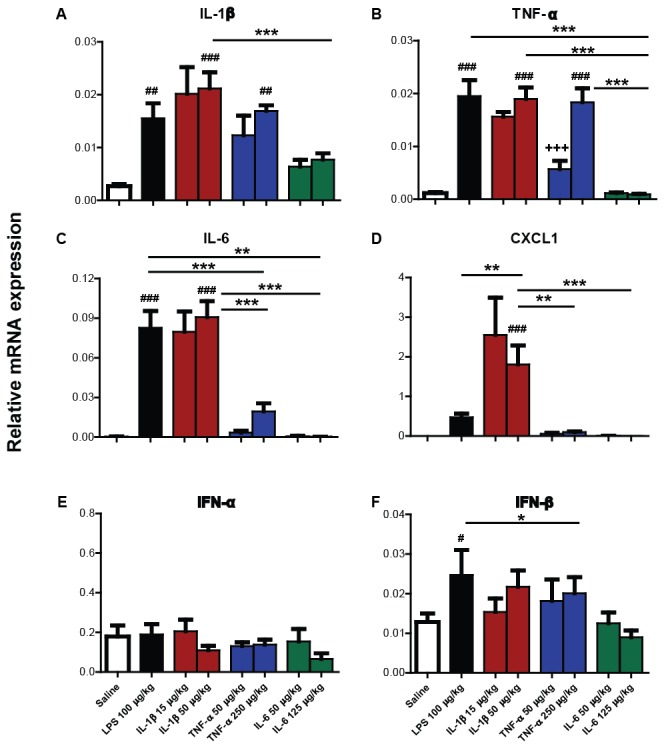
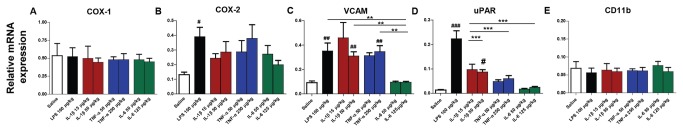
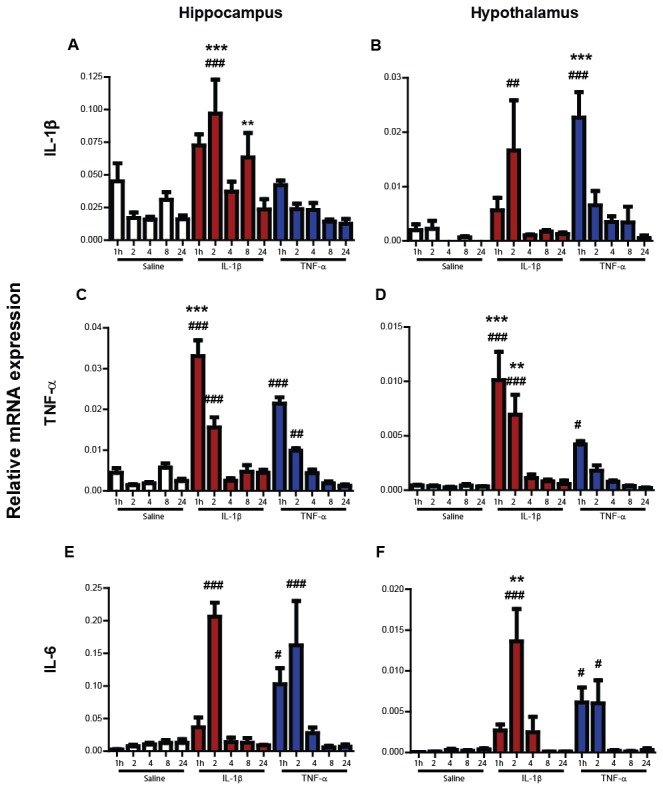
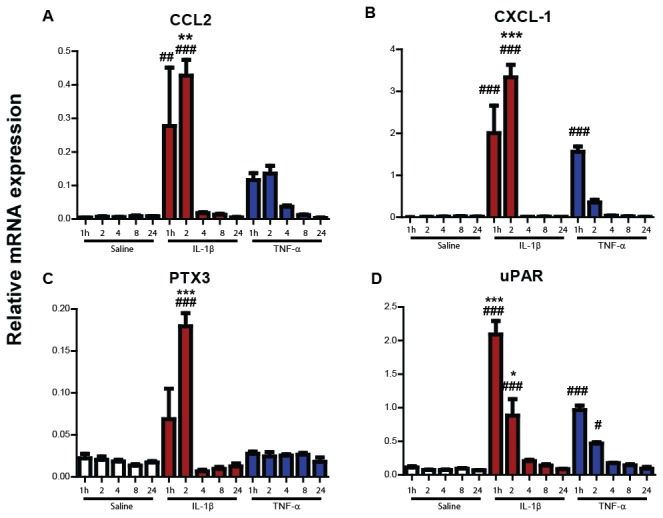
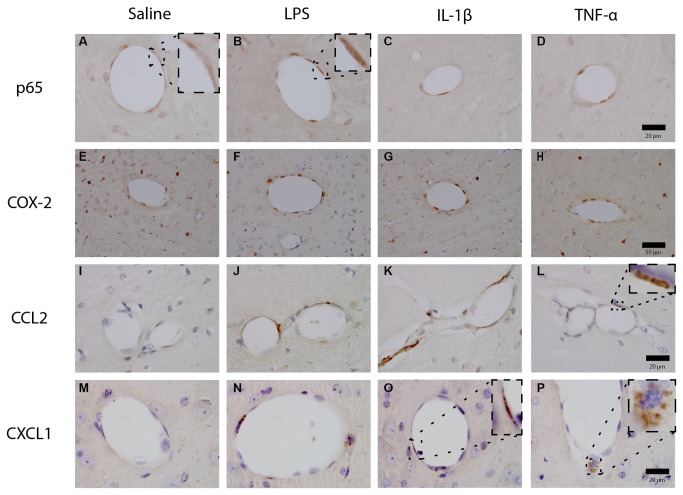
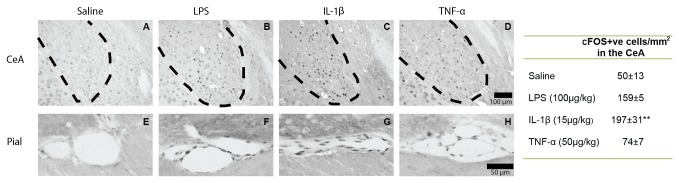
It is increasingly clear that systemic inflammation has both adaptive and deleterious effects on the brain. However, detailed comparisons of brain effects of systemic challenges with different pro-inflammatory cytokines are lacking. In the present study, we challenged female C57BL/6 mice intraperitoneally with LPS (100 µg/kg), IL-1β (15 or 50 µg/kg), TNF-α (50 or 250 µg/kg) or IL-6 (50 or 125 µg/kg). We investigated effects on core body temperature, open field activity and plasma levels of inflammatory markers at 2 hours post injection. We also examined levels of hepatic, hypothalamic and hippocampal inflammatory cytokine transcripts. Hypothermia and locomotor hypoactivity were induced by LPS>IL-1β>TNF-α>>IL-6. Systemic LPS, IL-1β and TNF-α challenges induced robust and broadly similar systemic and central inflammation compared to IL-6, which showed limited effects, but did induce a hepatic acute phase response. Important exceptions included IFNβ, which could only be induced by LPS. Systemic IL-1β could not induce significant blood TNF-α, but induced CNS TNF-α mRNA, while systemic TNF-α could induce IL-1β in blood and brain. Differences between IL-1β and TNF-α-induced hippocampal profiles, specifically for IL-6 and CXCL1 prompted a temporal analysis of systemic and central responses at 1, 2, 4, 8 and 24 hours, which revealed that IL-1β and TNF-α both induced the chemokines CXCL1 and CCL2 but only IL-1β induced the pentraxin PTX3. Expression of COX-2, CXCL1 and CCL2, with nuclear localisation of the p65 subunit of NFκB, in the cerebrovasculature was demonstrated by immunohistochemistry. Furthermore, we used cFOS immunohistochemistry to show that LPS, IL-1β and to a lesser degree, TNF-α activated the central nucleus of the amygdala. Given the increasing attention in the clinical literautre on correlating specific systemic inflammatory mediators with neurological or neuropsychiatric conditions and complications, these data will provide a useful resource on the likely CNS inflammatory profiles resulting from systemic elevation of particular cytokines.
Conflict of interest statement
Figures
Similar articles
-
MCP-1-deficient mice show reduced neuroinflammatory responses and increased peripheral inflammatory responses to peripheral endotoxin insult.J Neuroinflammation. 2008 Aug 15;5:35. doi: 10.1186/1742-2094-5-35. J Neuroinflammation. 2008. PMID: 18706086 Free PMC article.
-
Exacerbation of CNS inflammation and neurodegeneration by systemic LPS treatment is independent of circulating IL-1β and IL-6.J Neuroinflammation. 2011 May 17;8:50. doi: 10.1186/1742-2094-8-50. J Neuroinflammation. 2011. PMID: 21586125 Free PMC article.
-
Changes in central and peripheral inflammatory responses to lipopolysaccharide in ovariectomized female rats.Cytokine. 2014 Jan;65(1):65-73. doi: 10.1016/j.cyto.2013.10.004. Epub 2013 Oct 31. Cytokine. 2014. PMID: 24183967
-
The effect of non-steroidal anti-inflammatory agents on behavioural changes and cytokine production following systemic inflammation: Implications for a role of COX-1.Brain Behav Immun. 2010 Mar;24(3):409-19. doi: 10.1016/j.bbi.2009.11.006. Epub 2009 Dec 4. Brain Behav Immun. 2010. PMID: 19931610 Free PMC article.
-
The Role of Pro-Inflammatory and Regulatory Signaling by IL-33 in the Brain and Liver: A Focused Systematic Review of Mouse and Human Data and Risk of Bias Assessment of the Literature.Int J Mol Sci. 2020 May 30;21(11):3933. doi: 10.3390/ijms21113933. Int J Mol Sci. 2020. PMID: 32486265 Free PMC article.
Cited by
-
Insulin Resistance, a Risk Factor for Alzheimer's Disease: Pathological Mechanisms and a New Proposal for a Preventive Therapeutic Approach.Biomedicines. 2024 Aug 19;12(8):1888. doi: 10.3390/biomedicines12081888. Biomedicines. 2024. PMID: 39200352 Free PMC article. Review.
-
Recovery from an acute systemic and central LPS-inflammation challenge is affected by mouse sex and genetic background.PLoS One. 2018 Aug 22;13(8):e0201375. doi: 10.1371/journal.pone.0201375. eCollection 2018. PLoS One. 2018. PMID: 30133465 Free PMC article.
-
Inflammasome activation and pyroptosis mediate coagulopathy and inflammation in Salmonella systemic infection.Microbiol Res. 2023 Oct;275:127460. doi: 10.1016/j.micres.2023.127460. Epub 2023 Jul 14. Microbiol Res. 2023. PMID: 37467711 Free PMC article.
-
Ablation of PDE4B protects from Pseudomonas aeruginosa-induced acute lung injury in mice by ameliorating the cytostorm and associated hypothermia.FASEB J. 2021 Sep;35(9):e21797. doi: 10.1096/fj.202100495R. FASEB J. 2021. PMID: 34383981 Free PMC article.
-
Peripheral Administration of Tumor Necrosis Factor-Alpha Induces Neuroinflammation and Sickness but Not Depressive-Like Behavior in Mice.Biomed Res Int. 2015;2015:716920. doi: 10.1155/2015/716920. Epub 2015 Jul 28. Biomed Res Int. 2015. PMID: 26290874 Free PMC article.
References
-
- Steinman L (2004) Elaborate interactions between the immune and nervous systems. Nat Immunol 5: 575-581. doi:10.1038/ni1078. PubMed: 15164017. - DOI - PubMed
-
- Konsman JP, Parnet P, Dantzer R (2002) Cytokine-induced sickness behaviour: mechanisms and implications. Trends Neurosci 25: 154-159. doi:10.1016/S0166-2236(00)02088-9. PubMed: 11852148. - DOI - PubMed
-
- Dantzer R, O’Connor JC, Freund GG, Johnson RW, Kelley KW (2008) From inflammation to sickness and depression: when the immune system subjugates the brain. Nat Rev Neurosci 9: 46-56. doi:10.1038/nrn2297. PubMed: 18073775. - DOI - PMC - PubMed
-
- Dantzer R (2004) Cytokine-induced sickness behaviour: a neuroimmune response to activation of innate immunity. Eur J Pharmacol 500: 399-411. doi:10.1016/j.ejphar.2004.07.040. PubMed: 15464048. - DOI - PubMed
-
- Dantzer R (2001) Cytokine-induced sickness behavior: where do we stand? Brain Behav Immun 15: 7-24. doi:10.1006/brbi.2000.0613. PubMed: 11259077. - DOI - PubMed
Publication types
MeSH terms
Substances
Grants and funding
LinkOut - more resources
Full Text Sources
Other Literature Sources
Research Materials
Miscellaneous
