. 2013 Jul 3:2:e00778.
doi: 10.7554/eLife.00778.

Direct single molecule measurement of TCR triggering by agonist pMHC in living primary T cells

Affiliations

Direct single molecule measurement of TCR triggering by agonist pMHC in living primary T cells

Geoff P O'Donoghue et al. Elife. .

Abstract

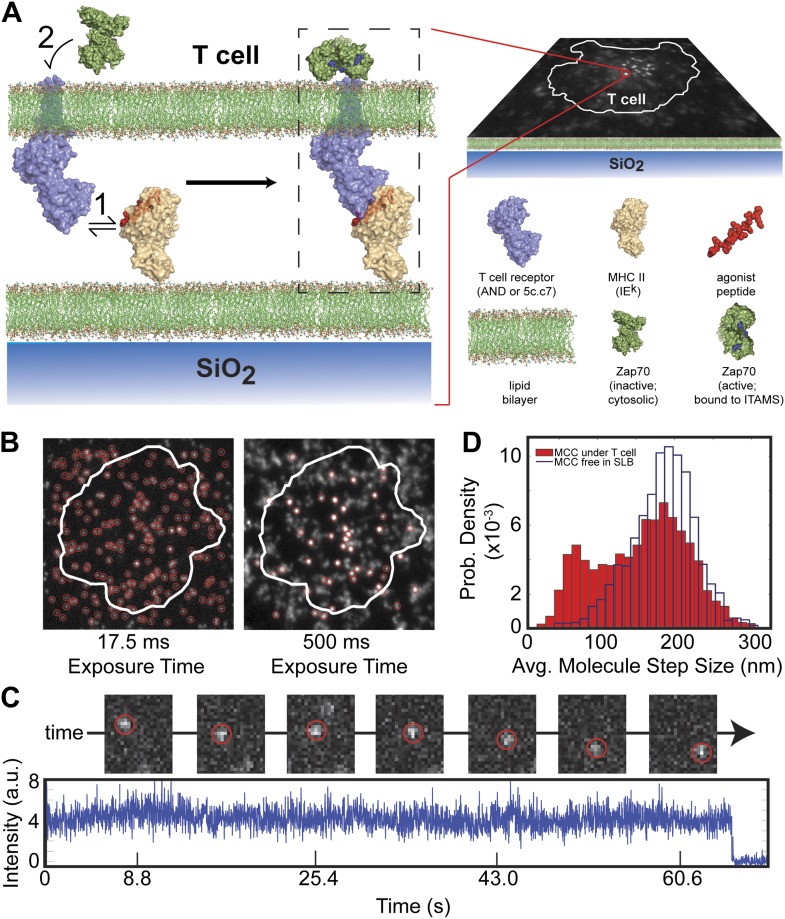
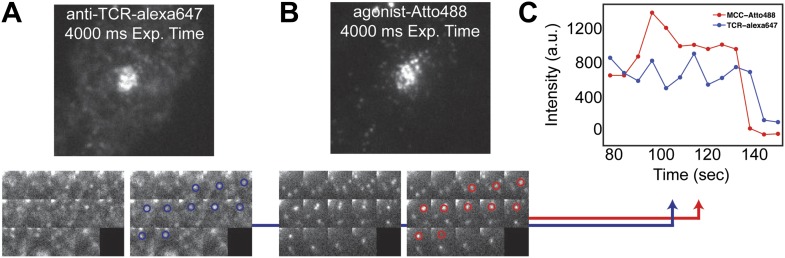
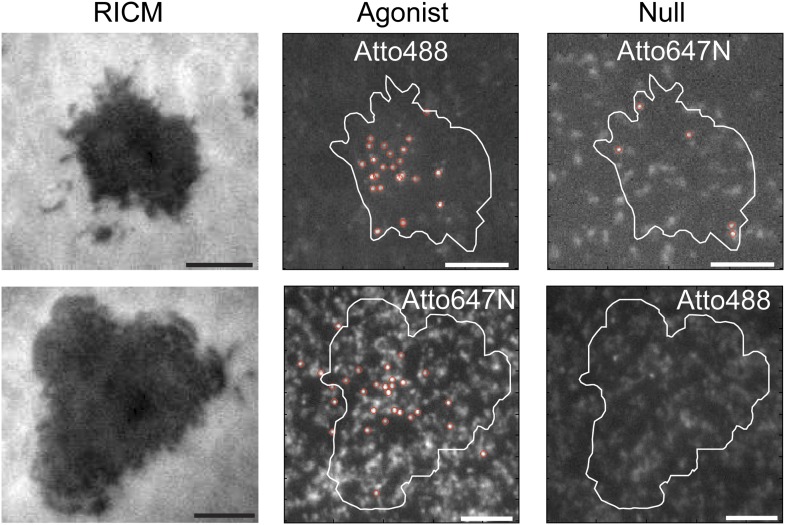
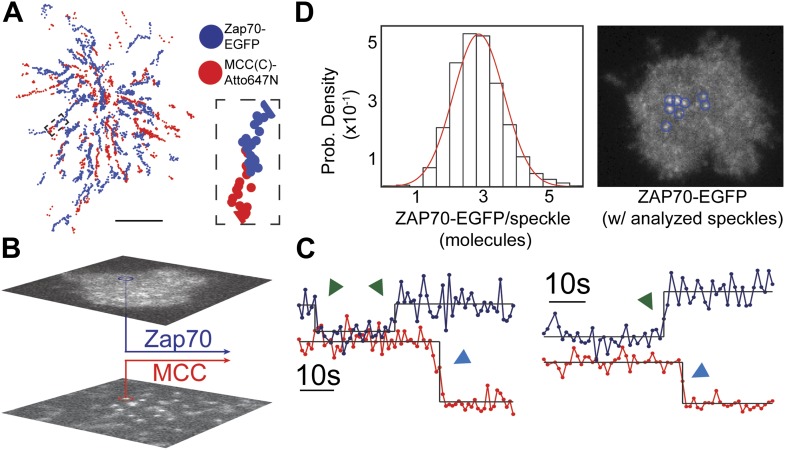
T cells discriminate between self and foreign antigenic peptides, displayed on antigen presenting cell surfaces, via the TCR. While the molecular interactions between TCR and its ligands are well characterized in vitro, quantitative measurements of these interactions in living cells are required to accurately resolve the physical mechanisms of TCR signaling. We report direct single molecule measurements of TCR triggering by agonist pMHC in hybrid junctions between live primary T cells and supported lipid membranes. Every pMHC:TCR complex over the entire cell is tracked while simultaneously monitoring the local membrane recruitment of ZAP70, as a readout of TCR triggering. Mean dwell times for pMHC:TCR molecular binding of 5 and 54 s were measured for two different pMHC:TCR systems. Single molecule measurements of the pMHC:TCR:ZAP70 complex indicate that TCR triggering is stoichiometric with agonist pMHC in a 1:1 ratio. Thus any signal amplification must occur downstream of TCR triggering. DOI:http://dx.doi.org/10.7554/eLife.00778.001.

Keywords: Mouse; T cells; TCR triggering; single molecule kinetics.


Conflict of interest statement

The authors declare that no competing interests exist.

Figures

Figure 1.
Figure 1.. Agonist pMHC binding to TCR in T cells is revealed by changes in mobility.
(A) Schematic of the hybrid live cell–SLB system. Binding of agonist pMHC to TCR (PDB, 3QIU) leads to phosphorylation of ITAMs, on the intracellular domain of the TCR, which is followed by recruitment of the kinase ZAP70 (PDB, 2OQI, 2OZO). We directly observe both pMHC:TCR binding and ZAP70:ITAM recruitment using single molecule fluorescence microscopy (bilayer adapted from Domanski et al., 2010). (B) At short exposure times (17.5 ms, left) all agonist pMHC molecules are readily resolved. Imaging with a long exposure time (500 ms, right) allows for unambiguous discrimination between the slow, TCR-bound fraction of agonist pMHC and the fast diffusing fraction. This also allows for long (1–10 s interval) time-lapse sequences (Video 1). Automated detection of single molecule features (red circles) is discussed in methods. (C) Representative intensity trace showing a single agonist pMHC molecule, identified by step photobleaching, bound continuously for ∼60 s. (D) Step size histogram of single agonist pMHC molecules in a SLB is bimodal under T cells (red) and unimodal before addition of T cells (blue). pMHC molecules in (B)–(D) were labeled with Atto647N on the MCC peptide. DOI: http://dx.doi.org/10.7554/eLife.00778.003
Figure 2.
Figure 2.. TCR and MCC agonist pMHC colocalization.
(A) and (B) TCR and agonist pMHC colocalize in bulk in the central supramolecular assembly cluster (cSMAC) and (C) at the single molecule level. Although TCR clusters were not readily observed in these experiments (even using a 4 s camera integration time), previous reports indicate that TCR does cluster at the agonist density (∼0.2 molecules/µm2) used here (Varma et al., 2006). However, these reports used GPI-MHC, which is problematic because this GPI-linked protein is associated with clustering in supported membranes (Manz et al., 2011; Dustin and Groves, 2012). The Ni2+-chelating lipids used in supported membranes for the experiments reported here have been shown to increase the likelihood that attached proteins are monodispersed (Manz et al., 2011; Xu et al., 2011), and this is confirmed by direct single molecule observation in our experiments. DOI: http://dx.doi.org/10.7554/eLife.00778.005
Figure 3.
Figure 3.. Agonist binding is specific and independent of fluorophore.
RICM images map the footprint of T cell adhesion to the SLB (mediated through LFA1:ICAM1 binding). T cells engage SLBs conjugated with mixtures of independently labeled MCC agonist and null peptide MHC. Only the MCC agonist pMHC is observed in the slow moving fraction, irrespective of which fluorescent label (Atto488 or Atto647N) it carries. DOI: http://dx.doi.org/10.7554/eLife.00778.006
Figure 4.
Figure 4.. ZAP70 recruitment, stoichiometry, and movement are consistent with 1:1 agonist pMHC:TCR stoichiometry.
(A) A spatial map of MCC-Atto647N single molecule (red) and ZAP70-EGFP (blue) puncta. Raw data are included as Videos 2 and 3. Data were recorded at 1 frame/s, such that each adjacent blue or red dot was recorded 1 s apart. Both single MCC agonist pMHC molecules and ZAP70-EGFP puncta follow linear trajectories towards the geometric center of the 2D cell–supported bilayer interface. (B) Single ZAP70-EGFP molecules recruited to single agonist pMHC molecules (labeled with MCC-Atto647N) are recorded using sub-pixel color registration (Figure 4—figure supplement 1). (C) Representative single molecule ZAP70-EGFP (blue) and MCC-Atto647N agonist pMHC (red) localized fluorescence intensity traces. Change-points are detected using a Bayesian change point algorithm (in black; see methods). Step decreases in MCC intensity (red) are most likely agonist pMHC:TCR unbinding events, since τoffτbl. Step increases in ZAP70 intensity (blue) are attributed to ZAP70:ITAM binding. (D) ZAP70-EGFP puncta brightness histogram is symmetric and centered at 136.0 counts ± 0.04 SEM and corresponds to an average of 2.9 ± 0.04 SEM EGFP molecules (using six single molecule ZAP70-EGFP traces from the same cell for intensity calibration). Bright ZAP70-EGFP speckles are detected from the raw data using an automated algorithm (blue circles; see methods). Scale bar 5 µm. DOI: http://dx.doi.org/10.7554/eLife.00778.007
Figure 4—figure supplement 1.
Figure 4—figure supplement 1.. Dual View color registration.
(A) Tetraspec beads adhered to piranha-etched coverglass are used to spatially register the EGFP and Atto647N channels in our split camera apparatus. Ten consecutive images are recorded and the coordinate map is generated in post processing (see ‘Materials and methods’). (B) and (C) Registration to less than one pixel (105 nm) is achieved across the majority of the 26 × 52 µm imaging area. T cells are typically 10 µm in diameter, and are imaged at the center of the field of view. DOI: http://dx.doi.org/10.7554/eLife.00778.008
Figure 4—figure supplement 2.
Figure 4—figure supplement 2.. Single molecule ZAP70-EGFP.
(A) The majority of single molecule agonist pMHC traces result in ZAP70-EGFP traces with intensity fluctuations consistent with the background. Step increases and decreases in ZAP70-EGFP intensity are rare, but single ZAP70-EGFP events are long-lived (12–107 s). Taken together, these observations indicate that rapid ZAP70-EGFP unbinding and rebinding in between observations is unlikely. If rapid unbinding/rebinding were to occur, then either single molecule ZAP70-EGFP traces would more frequent and shorter, or ZAP70-EGFP traces without single step intensity increases or decreases would be noisier. (B) A small minority of agonist pMHC traces exhibit two-step photobleaching, indicating pMHC dimerization. However, the ZAP70-EGFP output for these traces is equivalent to the ZAP70-EGFP output for single agonist pMHC single molecule traces. DOI: http://dx.doi.org/10.7554/eLife.00778.009
Figure 5.
Figure 5.. The distribution of live cell single molecule agonist pMHC:TCR molecular binding dwell times is observed directly.
Measured dwell time distributions for both the 5c.c7 (A) and AND (B) TCRs are roughly exponential and match reported solution measurements. Bleaching times, kbl1, (grey circles) are measured using agonist pMHC SLB standards without cells and with the same fluorescent label (Atto488) and are significantly longer than observed dwell times, τobs, for both TCRs. (C) Measured values for 5c.c7 and AND CD4+ T cells under varying conditions. Values in columns five and six represent ∼300–600 MCC agonist pMHC molecules per experimental condition from a population of 7–20 cells. Data are representative of at least 5 independent experiments performed on T cell blasts isolated from different mice for both the 5c.c7 and AND TCRs. Uncertainty in the average across different mice, shown in columns five and six, is calculated as the standard error of the mean of the molecular averages from different mice. In some cases (e.g. for cytoskeleton disruption experiments with Latrunculin A) one experiment (representative of 7–10 cells and 100 s of single molecule measurements) may be performed, but these data are always compared to a control sample recorded on the same day with T cell blasts from the same mouse. In these cases uncertainty is reported as the standard error of the mean of the molecular dwell time distribution. SPR measurements for 5c.c7 1(Huppa et al., 2010) and AND-related 226 TCRs 2(Newell et al., 2011), along with single molecule FRET measurements for 5c.c7 1(Huppa et al., 2010), are shown for comparison. DOI: http://dx.doi.org/10.7554/eLife.00778.012
Figure 6.
Figure 6.. Stochastic reaction-diffusion simulation of time before MCC agonist pMHC escape from TCR clusters, τesc (in color; log scale), as a function of τoff and TCR cluster size.
For small TCR clusters (1–100 TCR molecules) τoffτesc, indicating no serial rebinding. Only for unrealistically large TCR clusters (1000–10,000 molecules) does τesc become appreciably longer than τoff. DOI: http://dx.doi.org/10.7554/eLife.00778.013
Figure 6—figure supplement 1.
Figure 6—figure supplement 1.. Stochastic reaction-diffusion simulation of time before MCC agonist pMHC escape from TCR clusters.
Simulations of τescτoff as a function of TCR cluster size, τoff , and kon. The ratio τescτoff, which is an indicator of agonist pMHC entrapment, is a function of TCR cluster size and kon, but not koff. kon = 0.51 µm2s−1molecule−1 corresponds to the fastest average kon that allows for rebinding to the same TCR. Only for unrealistically large TCR cluster sizes (approaching 1000 TCRs per cluster) and fast kon is τescτoff1, meaning that entrapment due to millisecond-scale unbinding and rebinding is unlikely to result in the minute-scale dwell times observed in our experiments. DOI: http://dx.doi.org/10.7554/eLife.00778.014
Figure 7.
Figure 7.. Interaction of the 226 TCR with the MCC peptide.
(A) CDR3α (yellow) and CDR3β (orange) loops form all the specific interactions with the peptide (cyan). Hydrogen bonds between the CDR3 loops and the MCC residues are shown by dashed lines (PDB, 3QIU) (B) Comparison of CDR3 loops between the 226 and AND TCRs reveal identical sequences and suggest similar binding kinetics. 226 and AND also share Vα, Jα, Vβ, and Jβ gene segments that encode the residues specific for interaction with IEk (Newell et al., 2011). The residues involved in hydrogen bonds between 226 and MCC are shown in blue. DOI: http://dx.doi.org/10.7554/eLife.00778.015

References

    1. Adams JJ, Narayanan S, Liu B, Birnbaum ME, Kruse AC, Bowerman NA, et al. 2011. T cell receptor signaling is limited by docking geometry to peptide-major histocompatibility complex. Immunity 35:681–93. 10.1016/j.immuni.2011.09.013 - DOI - PMC - PubMed
    1. Altan-Bonnet G, Germain RN. 2005. Modeling T Cell antigen discrimination based on feedback control of digital ERK responses. PLoS Biol 3:e356. 10.1371/journal.pbio.0030356 - DOI - PMC - PubMed
    1. Axmann M, Huppa JB, Davis MM, Schütz GJ. 2012. Determination of interaction kinetics between the T cell receptor and peptide-loaded MHC class II via single-molecule diffusion measurements. Biophys J 103:L17–9. 10.1016/j.bpj.2012.06.019 - DOI - PMC - PubMed
    1. Bunnell SC, Hong DI, Kardon JR, Yamazaki T, McGlade CJ, Barr VA, et al. 2002. T cell receptor ligation induces the formation of dynamically regulated signaling assemblies. J Cell Biol 158:1263–75. 10.1083/jcb.200203043 - DOI - PMC - PubMed
    1. Burroughs NJ, Wulfing C. 2002. Differential segregation in a cell-cell contact interface: the dynamics of the immunological synapse. Biophys J 83:1784–96. 10.1016/S0006-3495(02)73944-1 - DOI - PMC - PubMed

Publication types

MeSH terms

Substances