. 2013 Jul 2:2:e00782.
doi: 10.7554/eLife.00782.

A longitudinal study of Caenorhabditis elegans larvae reveals a novel locomotion switch, regulated by G(αs) signaling

Affiliations

A longitudinal study of Caenorhabditis elegans larvae reveals a novel locomotion switch, regulated by G(αs) signaling

Stanislav Nagy et al. Elife. .

Abstract

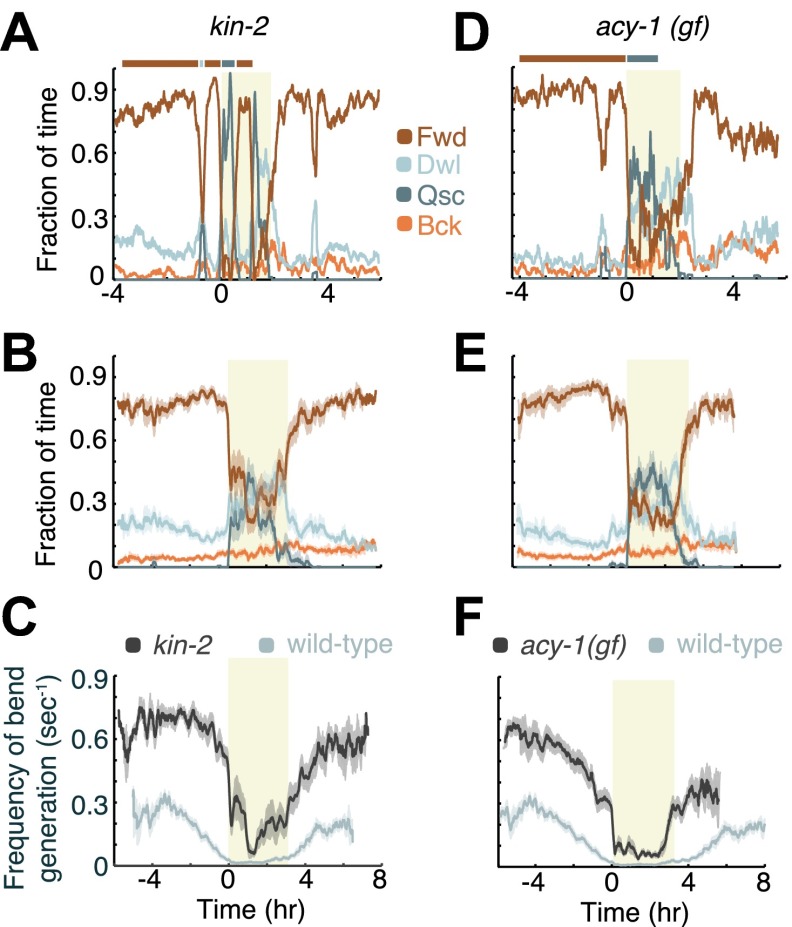
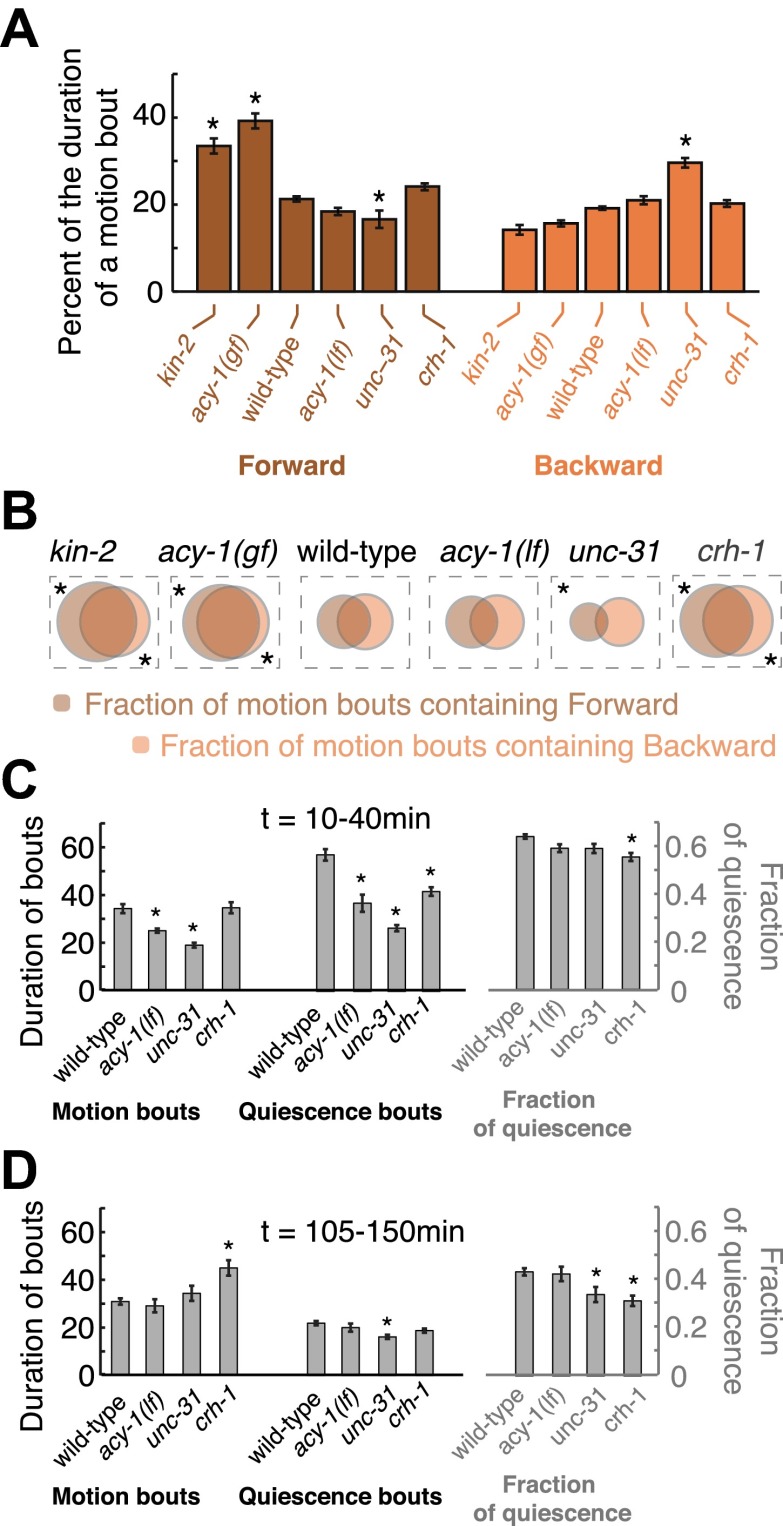
Despite their simplicity, longitudinal studies of invertebrate models are rare. We thus sought to characterize behavioral trends of Caenorhabditis elegans, from the mid fourth larval stage through the mid young adult stage. We found that, outside of lethargus, animals exhibited abrupt switching between two distinct behavioral states: active wakefulness and quiet wakefulness. The durations of epochs of active wakefulness exhibited non-Poisson statistics. Increased Gαs signaling stabilized the active wakefulness state before, during and after lethargus. In contrast, decreased Gαs signaling, decreased neuropeptide release, or decreased CREB activity destabilized active wakefulness outside of, but not during, lethargus. Taken together, our findings support a model in which protein kinase A (PKA) stabilizes active wakefulness, at least in part through two of its downstream targets: neuropeptide release and CREB. However, during lethargus, when active wakefulness is strongly suppressed, the native role of PKA signaling in modulating locomotion and quiescence may be minor. DOI:http://dx.doi.org/10.7554/eLife.00782.001.

Keywords: C. elegans; CREB; PKA; longitudinal study; modulation; quiet wakefulness; unc-31/CAPS.


Conflict of interest statement

The authors declare that no competing interests exist.

Figures

Figure 1.
Figure 1.. Measurements of angles associated with body-segments: the midline of the body of the worm was fitted to a spline and divided into 20 equal segments.
The local angle at each of the 18 inner segments, θi, was defined as the angle between its two flanking segments, si−1 and si+1. (A) Body-bends propagating from the head (left arrow) to the tail (right arrow) during forward locomotion in a wild-type mid L4 larva. For the purpose of demonstration, the local angles of only eight segments along the body were plotted. The color map corresponds to angles from the most anterior (brown), through the middle (orange and yellow), to the most posterior (grey) body-regions. Each bend appears as a peak or a trough in the local angle. A successive bend is initiated at the head ∼4 s before its predecessor reaches the tail. (B) Angles at the same eight body segments during early L4 lethargus. When the animal is quiescent the local angles remain constant or relax slowly. (C) The fraction of time, calculated from a 10 min running window, that individual body segments (as denoted on the worm schematic) are quiescent. Body-segments that are further removed from the head of the animal exhibit more quiescence than more anterior segments, such that the overall quiescent behavior associated with L4 lethargus reflects the quiescence of the head and the neck. (D) The length of the body (top) and the mean angle along its midline between the mid L4 and mid young adult stages. Shaded area denotes the L4 lethargus period. The reduction in body-length during lethargus may be a signature of growth in the volume of the body at a time when expanding the surface area of the body is constrained. Panels (C and D) depict N = 37 animals, mean ± SEM. Standard errors are illustrated as shadowed areas surrounding the plotted averages. DOI: http://dx.doi.org/10.7554/eLife.00782.003
Figure 2.
Figure 2.. Modulation of locomotion between the mid-L4 and mid-young-adult stages in wild-type animals.
(A) The locomotion behavior of each animal at each time-point was determined to belong to one of four characteristic classes: forward (Fwd), dwelling (Dwl), quiescence (Qsc) or backward (Bck). The average fractions of time out of a 10-min running window in which animals exhibited each of the four characteristic behaviors were plotted. (B) The frequency of generation of body-bends (top) and the velocity of bends that propagated from the anterior to the posterior of the body, that is, during forward locomotion. During lethargus, rearward propagating bends were rare, and a meaningful average could not be obtained. Panels (A and B) depict N = 37 animals, mean ± SEM. Standard errors are illustrated as shadowed areas surrounding the plotted averages. (C and D) The modulation of locomotion in single animals. The bars above each plot indicate epochs of active wakefulness (dark brown) or quiet wakefulness (light grey). In all panels the shaded rectangular area indicates the period of L4 lethargus. DOI: http://dx.doi.org/10.7554/eLife.00782.004
Figure 3.
Figure 3.. The dynamics of the active wakefulness state during the three hours prior to L4 lethargus in wild-type animals.
(A) A histogram of the durations of epochs of active wakefulness plotted on a log-log scale. Epoch durations longer than 3 min exhibited a power-law distribution with an exponent –(1+α) = −1.83±0.31. (B) Two displacements along the y-axis of a sample trace of the fraction of forward locomotion, Δy1 (between filled circles) and Δy2 (between empty circles). Both displacements correspond to an identical time interval, Δt. The time-averaged mean square displacement (TMSD) is calculated in two steps: (i) using a sliding window to calculate the mean squared displacements along traces of each of the individual animals (Golding and Cox, 2006); (ii) averaging the results obtained from the previous step for all animals. (C) The TMSD plotted on a log-log scale as a function of the time-interval, Δt. The TMSD was calculated for the subset of N = 20 animals where data 3 hr prior to the onset of L4leth was available (N = 20). The TMSD exhibited power-law growth with the exponent (1−α) = 0.32 ± 0.03, consistent with a value of α ≈ 0.7. Inset: for the purpose of illustration, the TMSD for a two-state Markov chain with a comparable mean duration of epochs is shown to reach its saturation value at Δt ≈ 400 s (vertical dashed line). DOI: http://dx.doi.org/10.7554/eLife.00782.005
Figure 4.
Figure 4.. Increased Gαs signaling stabilizes active wakefulness outside of L4leth.
The effects of increased Gαs signaling on locomotion were assayed using animals mutant in two genes: a loss of function mutation of kin-2, encoding a negative regulatory subunit of PKA, and a gain of function mutation of acy-1, encoding an adenylyl cyclase. (A and D) Locomotion dynamics of a single animal between the mid L4 and the mid young adult stages. In contrast to wild-type behavior, forward locomotion was also prominently observed during L4leth (see also Figures 7 and 8). (B and E) The average fractions of time out of a 10-min running window in which animals exhibited each of the four characteristic types of locomotion. (C and F) The frequency of generation of body-bends of mutant (dark grey) and wild-type (light grey, data from Figure 2B) animals. Panels (BF) depict Nkin-2 = 16 animals, Nacy-1(gf) = 17 animals, mean ± SEM. Standard errors are illustrated as shadowed areas surrounding the plotted averages. DOI: http://dx.doi.org/10.7554/eLife.00782.006
Figure 5.
Figure 5.. Decreased Gαs signaling destabilizes active wakefulness outside of L4leth.
The effects of decreased Gαs signaling on locomotion were assayed using a loss of function mutation of the adenylyl cyclase gene, acy-1. (A) Locomotion dynamics of a single animal between the mid L4 and the mid young adult stages (see also Figures 7and 8). (B) The average fractions of time out of a 10-min running window in which animals exhibited each of the four characteristic types of locomotion. (C) The frequency of generation of body-bends of mutant (dark grey) and wild-type (light grey, data from Figure 2B) animals. Panels (B and C) depict Nacy-1(lf)=15 animals, mean ± SEM. Standard errors are illustrated as shadowed areas surrounding the plotted averages. DOI: http://dx.doi.org/10.7554/eLife.00782.007
Figure 6.
Figure 6.. Decreased neuropeptide release (in animals mutant for the gene encoding UNC-31/CAPS), or decreased CREB activity (in animals mutant for the gene encoding the C. elegans CREB ortholog, CRH-1), destabilize active wakefulness outside of L4leth. Both UNC-31/CAPS and CRH-1 act downstream of PKA.
(A and D) Locomotion dynamics of a single animal between the mid L4 and the mid young adult stages (see also Figures 7 and 8). (B and E) The average fractions of time out of a 10-min running window in which animals exhibited each of the four characteristic types of locomotion. (C and F) The frequency of generation of body-bends of mutant (dark grey) and wild-type (light grey, data from Figure 2B) animals. Panels (BF) depict Nunc-31 = 19, Ncrh-1 = 16 animals, mean ± SEM. Standard errors are illustrated as shadowed areas surrounding the plotted averages. DOI: http://dx.doi.org/10.7554/eLife.00782.008
Figure 7.
Figure 7.. Comparisons of mutant and wild-type behavior before, during and after lethargus.
Panels (AD) aggregate the data collected during the 2–4 hr prior to the onset of L4leth, the 0–2 hr prior to the onset of L4leth, L4leth, and the 0–2 hr after the termination of L4leth. Each column summarizes the data for a given type of locomotion (Forward, Dwelling, Backward, and Quiescence) for all genotypes. Asterisks denote behavioral patters that were significantly different from wild-type (p<0.05). Each bar depicts mean ± SEM, and the sizes of the datasets are the same as in Figures 2, 4–6. DOI: http://dx.doi.org/10.7554/eLife.00782.009
Figure 8.
Figure 8.. Forward and backward locomotion during motion bouts, that is, bouts of non-quiescent behavior during lethargus.
(A) The percentage of the duration of individual motion bouts that was spent in directed locomotion (forward—left, backward—right) on each of the genetic backgrounds. (B) Venn diagrams depicting the fraction of motion bouts (out of the total number of motion bouts that were longer than 10 s) where any forward or backward locomotion was detected. Increased Gαs signaling resulted in a larger fraction of motion bouts that included directed motion, and a larger percentage of the total duration of individual bouts that was spent in directed locomotion. Partially decreased Gαs signaling resulted in wild-type-like motion bouts. Strongly decreased neuropeptide release resulted in a mild reduction in forward locomotion and a mild increase in backward locomotion during motion bouts. Loss of CREB function increased the fraction of motion bouts that included directed locomotion, as compared with wild-type. Asterisks denote behavioral patters that were significantly different from wild-type (p<0.05). (C–D) The effects of Gαs signaling on the duration of bouts and the fraction of time spent in quiescence during two time intervals: t = 10–40 min (C), and t = 105–250 min (D), where t = 0 corresponds to the onset of L4leth. DOI: http://dx.doi.org/10.7554/eLife.00782.010

Similar articles

Cited by

References

    1. Baba T, Sakisaka T, Mochida S, Takai Y. 2005. PKA-catalyzed phosphorylation of tomosyn and its implication in Ca2+-dependent exocytosis of neurotransmitter. J Cell Biol 170:1113–25.10.1083/jcb.200504055 - DOI - PMC - PubMed
    1. Bargmann CI. 2012. Beyond the connectome: how neuromodulators shape neural circuits. Bioessays 34:458–65.10.1002/bies.201100185 - DOI - PubMed
    1. Belfer SJ, Chuang H-S, Freedman BL, Yuan J, Norton M, Bau HHet al. 2013. Caenorhabditis-in-drop array for monitoring C. elegans quiescent behavior. Sleep 36:689–98.10.5665/sleep.2628 - DOI - PMC - PubMed
    1. Boyle JH, Berri S, Tassieri M, Hope IA, Cohen N. 2011. Gait modulation in C. elegans: it’s not a choice, it’s a reflex! Front Behav Neurosci 5:10.10.3389/fnbeh.2011.00010 - DOI - PMC - PubMed
    1. Brenner S. 1974. The genetics of Caenorhabditis elegans. Genetics 77:71–94.10.1051/medsci/20031967725 - DOI - PMC - PubMed

Publication types

Substances