. 2013 Jun 20;3(3):290-301.
Print 2013.

Identification of two regions in the p140Cap adaptor protein that retain the ability to suppress tumor cell properties

Affiliations

Identification of two regions in the p140Cap adaptor protein that retain the ability to suppress tumor cell properties

Nanaocha Sharma et al. Am J Cancer Res. .

Abstract

p140Cap is an adaptor protein that negatively controls tumor cell properties, by inhibiting in vivo tumor growth and metastasis formation. Our previous data demonstrated that p140Cap interferes with tumor growth and impairs invasive properties of cancer cells inactivating signaling pathways, such as the tyrosine kinase Src or E-cadherin/EGFR cross-talk. In breast cancer p140Cap expression inversely correlates with tumor malignancy. p140Cap is composed of several conserved domains that mediate association with specific partners. Here we focus our attention on two domains of p140Cap, the TER (Tyrosine Enriched Region) which includes several tyrosine residues, and the CT (Carboxy Terminal) which contains a proline rich sequence, involved in binding to SH2 and SH3 domains, respectively. By generating stable cell lines expressing these two proteins, we demonstrate that both TER and CT domains maintain the ability to associate the C-terminal Src kinase (Csk) and Src, to inhibit Src activation and Focal adhesion kinase (Fak) phosphorylation, and to impair in vitro and in vivo tumor cell features. In particular expression of TER and CT proteins in cancer cells inhibits in vitro and in vivo growth and directional migration at a similar extent of the full length p140Cap protein. Moreover, by selective point mutations and deletion we show that the ability of the modules to act as negative regulators of cell migration and proliferation mainly resides on the two tyrosines (Y) inserted in the EPLYA and EGLYA sequences in the TER module and in the second proline-rich stretch contained in the CT protein. Gene signature of cells expressing p140Cap, TER or CT lead to the identification of a common pattern of 105 down-regulated and 128 up-regulated genes, suggesting that the three proteins can act through shared pathways. Overall, this work highlights that the TER and CT regions of p140Cap can efficiently suppress tumor cell properties, opening the perspective that short, defined p140Cap regions can have therapeutic effects.

Keywords: Csk; Src; breast cancer; cell signaling; colon cancer; lung cancer; p140Cap.


Figures
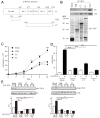
Figure 1
Figure 1
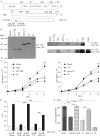
Expression of TER and CT modules affects MDA-MB-231 in vitro cell proliferation, migration, and Src and Fak phosphorylation. A. Schematic representation of p140Cap FL, NT, TER and CT protein structure. The position of relevant domains is indicated: Tyr = Tyrosine, Pro = Proline, C1/C2 coiled/coil, Ch = charged amino acids. The numbers indicate the amino acid position. B. Upper panels. To evaluate the association with Csk and Src, four mg extracts of MDA-MB-231 cells stably expressing Mock, NT, CT and FL p140Cap, all tagged with EGFP, were immunoprecipitated with antibodies to GFP. ¾ of the material was run on 8% SD-PAGE and western blotted with antibodies to Csk and Src. Input: fifty micrograms of FL p140Cap cell extract. Lower panel. For quantification of GFP-tagged fusion proteins expression, the remaining immunoprecipitate was run on 6% SDS-PAGE and blotted with antibodies to GFP. C. For assessing cell proliferation, 1 x 10⁴ cells were plated in 12 wells dishes in 10% FCS DMEM culture medium. Each second day cells three wells were detached and counted manually. The mean number of cells is represented by y-axis. The results are representative of three independent experiment. The data were evaluated with two-way ANOVA followed by Bonferroni multiple comparison post hoc tests (*P < 0.05; **P < 0.01; ***P < 0.001).D. For assessing cell migration, cells were starved overnight, detached and plated (5 x 10⁴) on fibronectin-precoated Transwells. Cells were allowed to migrate with or without 20% FCS for 2 hours. Cells migrating to the lower side were fixed and stained with Diff-Quick kit. The mean number of migrated cells was counted in 10 random fields. Mean values were calculated on five independent experiment. The data were evaluated with one-way ANOVA followed by Bonferroni multiple comparison post hoc tests (*P < 0.05; **P < 0.01; ***P < 0.001). E. Cells were starved over night and treated with 20% FCS for 30 min. Cell extracts were run on 8% SDS-PAGE and western blotted with antibodies to the activated Src (pSrc Y416), Src, tyrosine phosphorylated Fak (pFak Y925) and Fak. The histograms show the ratio between phosphorylated and total amount of protein in arbitrary units. (*P < 0.05, Student’s t-test; **P < 0.01).
Figure 2
Figure 2
Expression of TER and CT modules affects MDA-MB-231, and HT-29 in vivo tumor growth. A. 1 x 10⁷ MDA-MB-231 cells expressing TER, CT and FL p140Cap or Mock were mixed with Matrigel and injected subcutaneously in the two flanks of 5 week old female SCID mice. Four mice for each cell type wahe size of the tumors was evaluated twice a week using caliper for 60 days. B. 1 x 10⁶ HT-29 cells over-expressing TER, CT and FL p140Cap or Mock were injected as in A. The size of the tumors was evaluated twice a week using calliper for 28 days. A-C: The results are representative of two independent experiments, with a number of six tumors for each cell type in each experiment. Differences in tumor volume were evaluated with two-way ANOVA followed by Bonferroni multiple comparison post hoc tests (*P < 0.05; **P < 0.01; ***P < 0.001).
Figure 3
Figure 3
Expression of TER and CT mutants affects specific properties of TER and CT proteins. A. Left panel. Schematic representation of p140Cap FL, TER and CT protein structure and their respective mutants PG-TER and DeltaPro-CT. In PG-TER the tyrosines (Y) in 264 and 396 have been mutated in phenylalanine (F). In DeltaPro-CT a region spanning amino acid 1000-1048 has been deleted. Right panel. For quantification of GFP-tagged fusionproteins expression, 50 microgram cell extracts were run on 6% SDS-PAGE and blotted with antibodies to GFP. B. To evaluate the association with Csk and Src, four mg extracts of MDA-MB-231 cells stably expressing the different GFP-tagged fusion proteins, were immunoprecipitated with antibodies to GFP, run on 8% SD-PAGE and western blotted with antibodies to Src and Csk. Input: fifty micrograms of FL p140Cap cell extract. A lower exposure for Csk is shown on the right. C. For assessing cell proliferation, 1 x 10⁴ cells were plated in 12 wells dishes in 10% FCS, DMEM culture medium. Each second day cells three wells were detached and counted manually. The mean number of cells is represented by y-axis. The results are representative of three independent experiments. Left panel: Mock, TER, PG-TER and FL. The data were evaluated with two-way ANOVA followed by Bonferroni multiple comparison post hoc tests (*P < 0.05; **P < 0.01; ***P < 0.001). Mock cells were significantly different from TER, PG-TER and FL that do not differ each other. Right panel: Mock, CT, DeltaPro-CT and FL. The data from Mock cells significantly different from CT anf FL, and not for DeltaPro-CT. D. For assessing anchorage-independent growth, Mock, TER, PG-TER, CT, DeltaPro-CT, and FL cells were plated in a soft agar assay and let to grow for three weeks. The bars represent the mean number of colonies for each cell type, as counted in four random fields under a phase-contrast microscope at 20X magnification. The data were evaluated with one-way ANOVA followed by Bonferroni multiple comparison post hoc tests (*P < 0.05; **P < 0.01; ***P < 0.001). E. For assessing cell migration, Mock, TER, PG-TER, CT, DeltaPro-CT, and FL cells were starved overnight, detached and plated (5 x 10⁴) on fibronectin-precoated Transwells. Cells were allowed to migrate with or without 10% FCS for 2 hours. The mean number of migrated cells was counted in 10 random fields. The data were evaluated with one-way ANOVA followed by Bonferroni multiple comparison post hoc tests (*P < 0.05; **P < 0.01; ***P < 0.001).
Figure 4
Figure 4
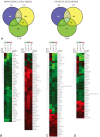
Gene expression and Gene Ontology enrichment analysis. Total RNA was extracted from MDA-MB-231 cells expressing TER, CT, FL or Mock cells and hybridized to Human Whole Genome Oligo Microarray 8 x 60 K (Agilent Technologies). A. Venn diagrams to depict the commonly regulated genes by expression of the three constructs (FL, CT and TER) were created with the help of the on-line tool Venny (http://bioinfogp.cnb.csic.es/tools/venny/index.html). B. The genes modulated in at least one condition in the three GO Biological Processes level 5 (BP5) (left panel: Regulation of Signal Transduction; medium panel: Positive Regulation of Cell Proliferation; right panel: Cell Migration) were selected to create expression matrices containing the log fold change of the expression of each gene in FL, TER and CT compared to Mock. The matrices were then loaded in Tigr MultiExperiment Viewer (TmeV version 4.6.1, http://www.tm4.org/mev/) to generate heatmaps by means of hierarchical clustering.

References

    1. Cabodi S, del Pilar Camacho-Leal M, Di Stefano P, Defilippi P. Integrin signalling adaptors: not only figurants in the cancer story. Nat Rev Cancer. 2010;10:858–870. - PubMed
    1. Damiano L, Di Stefano P, Camacho Leal MP, Barba M, Mainiero F, Cabodi S, Tordella L, Sapino A, Castellano I, Canel M, Frame M, Turco E, Defilippi P. p140Cap dual regulation of E-cadherin/EGFR cross-talk and Ras signalling in tumour cell scatter and proliferation. Oncogene. 2010;29:3677–3690. - PubMed
    1. Chin LS, Nugent RD, Raynor MC, Vavalle JP, Li L. SNIP, a novel SNAP-25-interacting protein implicated in regulated exocytosis. J Biol Chem. 2000;275:1191–1200. - PubMed
    1. Di Stefano P, Cabodi S, Boeri Erba E, Margaria V, Bergatto E, Giuffrida MG, Silengo L, Tarone G, Turco E, Defilippi P. P130Cas-associated protein (p140Cap) as a new tyrosine-phosphorylated protein involved in cell spreading. Mol Biol Cell. 2004;15:787–800. - PMC - PubMed
    1. Di Stefano P, Damiano L, Cabodi S, Aramu S, Tordella L, Praduroux A, Piva R, Cavallo F, Forni G, Silengo L, Tarone G, Turco E, Defilippi P. p140Cap protein suppresses tumour cell properties, regulating Csk and Src kinase activity. EMBO J. 2007;26:2843–2855. - PMC - PubMed

LinkOut - more resources