

TrkAIII promotes microtubule nucleation and assembly at the centrosome in SH-SY5Y neuroblastoma cells, contributing to an undifferentiated anaplastic phenotype
- PMID: 23841091
- PMCID: PMC3690223
- DOI: 10.1155/2013/740187
TrkAIII promotes microtubule nucleation and assembly at the centrosome in SH-SY5Y neuroblastoma cells, contributing to an undifferentiated anaplastic phenotype
Abstract
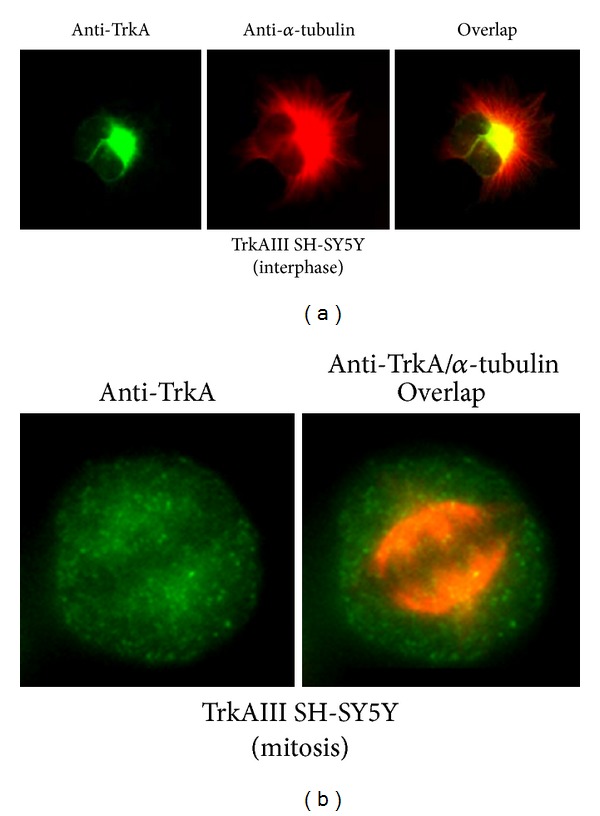
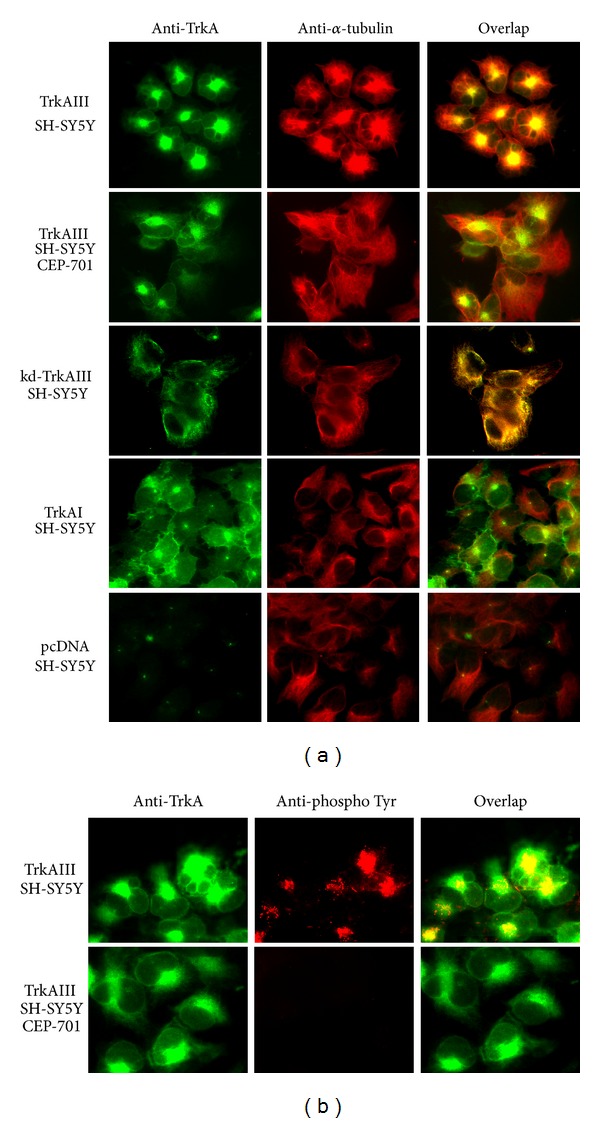
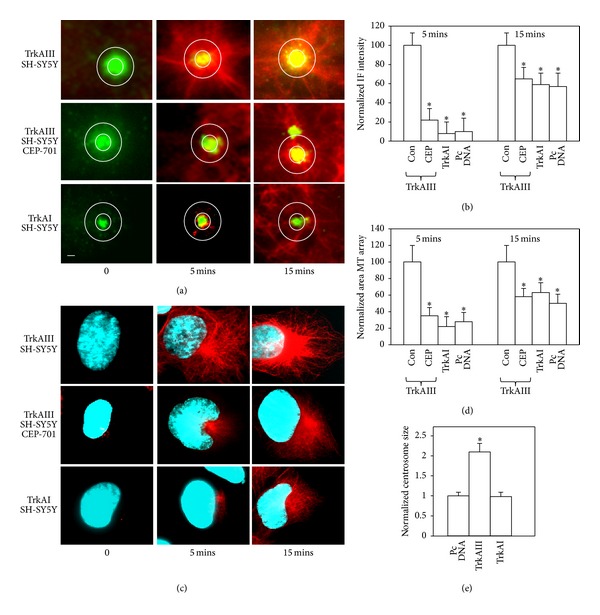
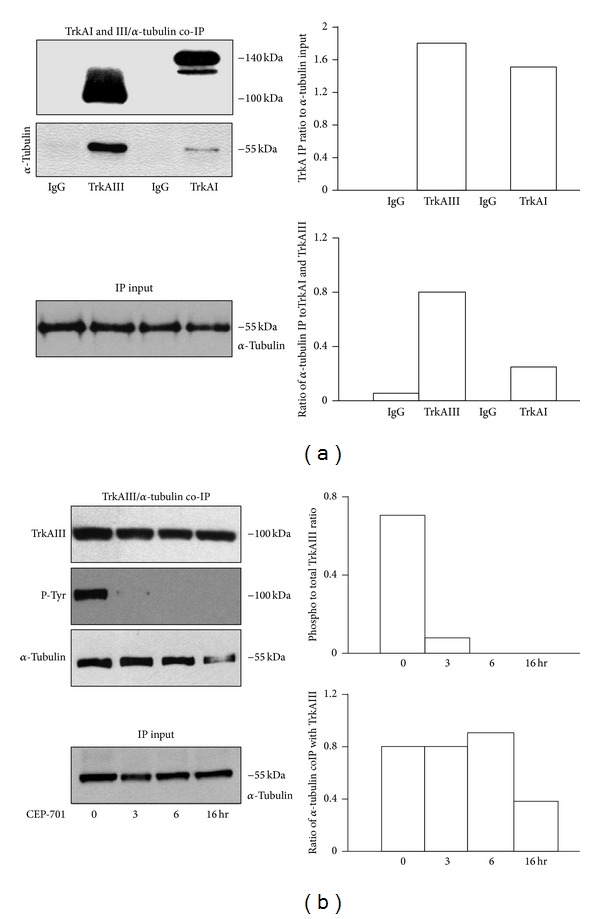
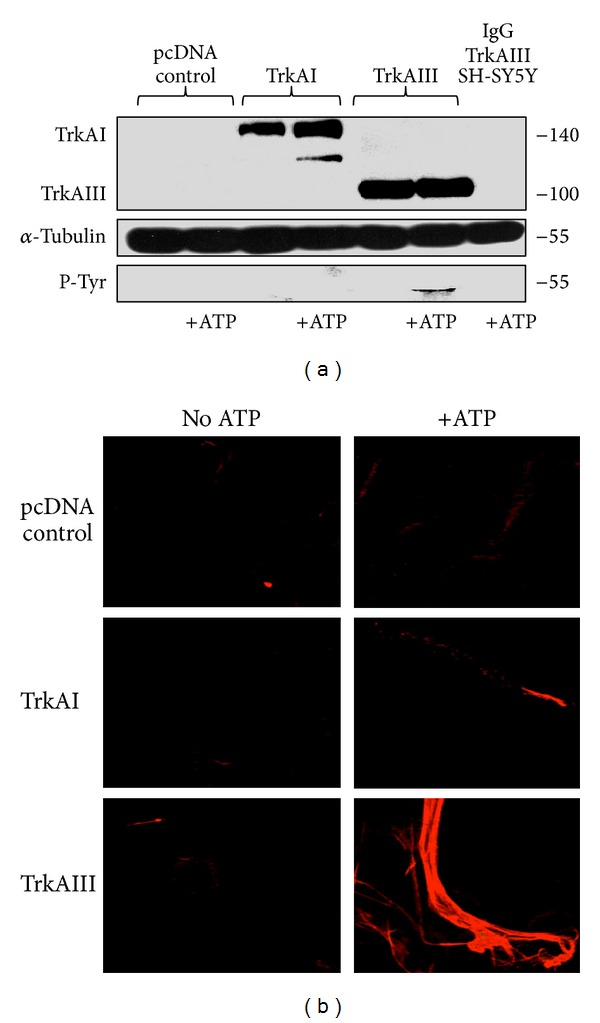
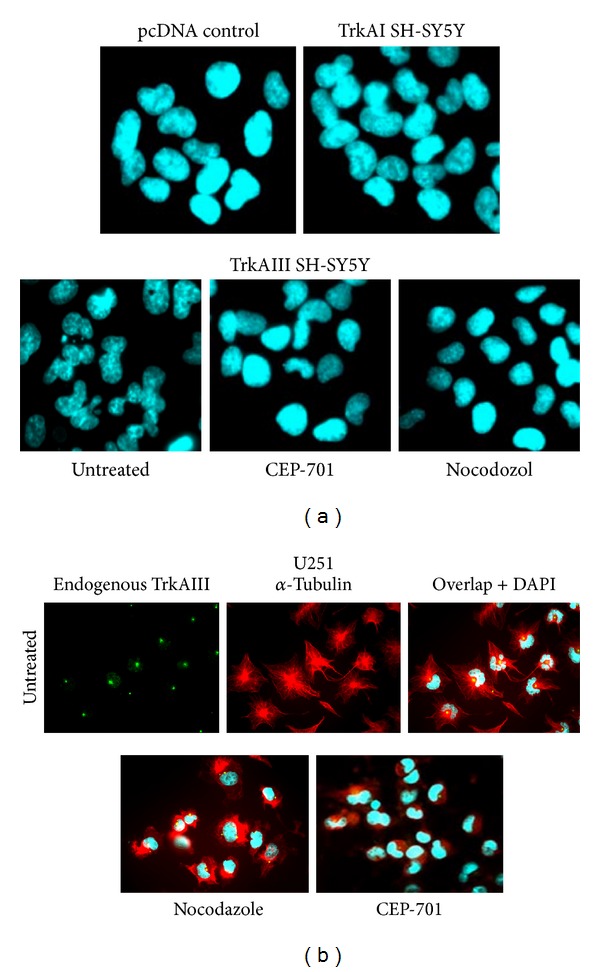
The alternative TrkAIII splice variant is expressed by advanced stage human neuroblastomas (NBs) and exhibits oncogenic activity in NB models. In the present study, employing stable transfected cell lines and assays of indirect immunofluorescence, immunoprecipitation, Western blotting, microtubule regrowth, tubulin kinase, and tubulin polymerisation, we report that TrkAIII binds α -tubulin and promotes MT nucleation and assembly at the centrosome. This effect depends upon spontaneous TrkAIII activity, TrkAIII localisation to the centrosome and pericentrosomal area, and the capacity of TrkAIII to bind, phosphorylate, and polymerise tubulin. We propose that this novel role for TrkAIII contributes to MT involvement in the promotion and maintenance of an undifferentiated anaplastic NB cell morphology by restricting and augmenting MT nucleation and assembly at the centrosomal MTOC.
Figures
Similar articles
-
TRAIL induces pro-apoptotic crosstalk between the TRAIL-receptor signaling pathway and TrkAIII in SH-SY5Y cells, unveiling a potential therapeutic "Achilles heel" for the TrkAIII oncoprotein in neuroblastoma.Oncotarget. 2016 Dec 6;7(49):80820-80841. doi: 10.18632/oncotarget.13098. Oncotarget. 2016. PMID: 27821809 Free PMC article.
-
The alternative TrkAIII splice variant targets the centrosome and promotes genetic instability.Mol Cell Biol. 2009 Sep;29(17):4812-30. doi: 10.1128/MCB.00352-09. Epub 2009 Jun 29. Mol Cell Biol. 2009. PMID: 19564412 Free PMC article.
-
The TrkAIII oncoprotein inhibits mitochondrial free radical ROS-induced death of SH-SY5Y neuroblastoma cells by augmenting SOD2 expression and activity at the mitochondria, within the context of a tumour stem cell-like phenotype.PLoS One. 2014 Apr 15;9(4):e94568. doi: 10.1371/journal.pone.0094568. eCollection 2014. PLoS One. 2014. PMID: 24736663 Free PMC article.
-
The oncogenic neurotrophin receptor tropomyosin-related kinase variant, TrkAIII.J Exp Clin Cancer Res. 2018 Jun 18;37(1):119. doi: 10.1186/s13046-018-0786-3. J Exp Clin Cancer Res. 2018. PMID: 29914559 Free PMC article. Review.
-
Alternative TrkAIII splicing: a potential regulated tumor-promoting switch and therapeutic target in neuroblastoma.Future Oncol. 2005 Oct;1(5):689-98. doi: 10.2217/14796694.1.5.689. Future Oncol. 2005. PMID: 16556046 Review.
Cited by
-
TrkAIII signals endoplasmic reticulum stress to the mitochondria in neuroblastoma cells, resulting in glycolytic metabolic adaptation.Oncotarget. 2017 Dec 22;9(9):8368-8390. doi: 10.18632/oncotarget.23618. eCollection 2018 Feb 2. Oncotarget. 2017. PMID: 29492201 Free PMC article.
-
Nerve growth factor: role in growth, differentiation and controlling cancer cell development.J Exp Clin Cancer Res. 2016 Jul 21;35(1):116. doi: 10.1186/s13046-016-0395-y. J Exp Clin Cancer Res. 2016. PMID: 27439311 Free PMC article. Review.
-
TRAIL induces pro-apoptotic crosstalk between the TRAIL-receptor signaling pathway and TrkAIII in SH-SY5Y cells, unveiling a potential therapeutic "Achilles heel" for the TrkAIII oncoprotein in neuroblastoma.Oncotarget. 2016 Dec 6;7(49):80820-80841. doi: 10.18632/oncotarget.13098. Oncotarget. 2016. PMID: 27821809 Free PMC article.
-
Mechanisms involved in selecting and maintaining neuroblastoma cancer stem cell populations, and perspectives for therapeutic targeting.World J Stem Cells. 2021 Jul 26;13(7):685-736. doi: 10.4252/wjsc.v13.i7.685. World J Stem Cells. 2021. PMID: 34367474 Free PMC article. Review.
-
Retrograde TrkAIII transport from ERGIC to ER: a re-localisation mechanism for oncogenic activity.Oncotarget. 2015 Nov 3;6(34):35636-51. doi: 10.18632/oncotarget.5802. Oncotarget. 2015. PMID: 26415233 Free PMC article.
References
-
- Tacconelli A, Farina AR, Cappabianca L, et al. TrkA alternative splicing: a regulated tumor-promoting switch in human neuroblastoma. Cancer Cell. 2004;6(4):347–360. - PubMed
-
- Tacconelli A, Farina AR, Cappabianca L, et al. TrkAIII expression in the thymus. Journal of Neuroimmunology. 2007;183(1-2):151–161. - PubMed
-
- Farina AR, Tacconelli A, Cappabianca L, et al. The neuroblastoma tumour-suppressor trkAI and its oncogenic alternative trkAIII splice variant exhibit geldanamycin-sensitive interactions with Hsp90 in human neuroblastoma cells. Oncogene. 2009;28(46):4075–4094. - PubMed
-
- Farina AR, Cappabianca L, Ruggeri P, et al. Alternative TrkA splicing and neuroblastoma. In: Shimada H, editor. Neuroblastoma Present and Future. Croatia: Intech; 2012. pp. 111–136.
Publication types
MeSH terms
Substances
LinkOut - more resources
Full Text Sources
Other Literature Sources
Medical
Research Materials
Miscellaneous
