Inferring signalling networks from images
- PMID: 23841886
- PMCID: PMC4217379
- DOI: 10.1111/jmi.12062
Inferring signalling networks from images
Abstract
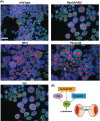
The mapping of signalling networks is one of biology's most important goals. However, given their size, complexity and dynamic nature, obtaining comprehensive descriptions of these networks has proven extremely challenging. A fast and cost-effective means to infer connectivity between genes on a systems-level is by quantifying the similarity between high-dimensional cellular phenotypes following systematic gene depletion. This review describes the methodology used to map signalling networks using data generated in the context of RNAi screens.
Keywords: Heterogeneity; RNAi; image analysis; morphological signatures; signalling networks.
© 2013 The Authors Journal of Microscopy © 2013 Royal Microscopical Society.
Figures


Similar articles
-
An automatic method for robust and fast cell detection in bright field images from high-throughput microscopy.BMC Bioinformatics. 2013 Oct 4;14:297. doi: 10.1186/1471-2105-14-297. BMC Bioinformatics. 2013. PMID: 24090363 Free PMC article.
-
Imaging techniques for measuring the materials properties of cells.Cold Spring Harb Protoc. 2011 Apr 1;2011(4):pdb.top107. doi: 10.1101/pdb.top107. Cold Spring Harb Protoc. 2011. PMID: 21460060 No abstract available.
-
Descriptive no more: the dawn of high-throughput microscopy.Trends Cell Biol. 2010 Sep;20(9):503-6. doi: 10.1016/j.tcb.2010.06.008. Epub 2010 Jul 29. Trends Cell Biol. 2010. PMID: 20667736 Free PMC article.
-
Single-molecule imaging of stochastic signaling events in living cells.Cold Spring Harb Protoc. 2012 Mar 1;2012(3):267-78. doi: 10.1101/pdb.top068189. Cold Spring Harb Protoc. 2012. PMID: 22383647 Review.
-
Functionally-Relevant Morphological Profiling: A Tool to Assess Cellular Heterogeneity.Trends Biotechnol. 2018 Jan;36(1):105-118. doi: 10.1016/j.tibtech.2017.10.007. Epub 2017 Nov 7. Trends Biotechnol. 2018. PMID: 29126572 Review.
Cited by
-
KCML: a machine-learning framework for inference of multi-scale gene functions from genetic perturbation screens.Mol Syst Biol. 2020 Mar;16(3):e9083. doi: 10.15252/msb.20199083. Mol Syst Biol. 2020. PMID: 32141232 Free PMC article.
-
How cells explore shape space: a quantitative statistical perspective of cellular morphogenesis.Bioessays. 2014 Dec;36(12):1195-203. doi: 10.1002/bies.201400011. Epub 2014 Sep 12. Bioessays. 2014. PMID: 25220035 Free PMC article.
-
RNAi library screening reveals Gβ1, Casein Kinase 2 and ICAP-1 as novel regulators of LFA-1-mediated T cell polarity and migration.Immunol Cell Biol. 2025 Jan;103(1):73-92. doi: 10.1111/imcb.12838. Epub 2024 Nov 28. Immunol Cell Biol. 2025. PMID: 39607284 Free PMC article.
References
-
- Bakal C, Aach J, Church G. Perrimon N. Quantitative morphological signatures define local signaling networks regulating cell morphology. Science. 2007;316:1753–1756. - PubMed
-
- Bork P. Serrano L. Towards cellular systems in 4D. Cell. 2005;121:507–509. - PubMed
-
- Boutros M, Kiger AA, Armknecht S, et al. Genome-wide RNAi analysis of growth and viability in Drosophila cells. Science. 2004;303:832–835. - PubMed
Publication types
MeSH terms
Grants and funding
LinkOut - more resources
Full Text Sources
Other Literature Sources

