

Population pharmacokinetics of mefloquine, piperaquine and artemether-lumefantrine in Cambodian and Tanzanian malaria patients
- PMID: 23841950
- PMCID: PMC3720542
- DOI: 10.1186/1475-2875-12-235
Population pharmacokinetics of mefloquine, piperaquine and artemether-lumefantrine in Cambodian and Tanzanian malaria patients
Abstract
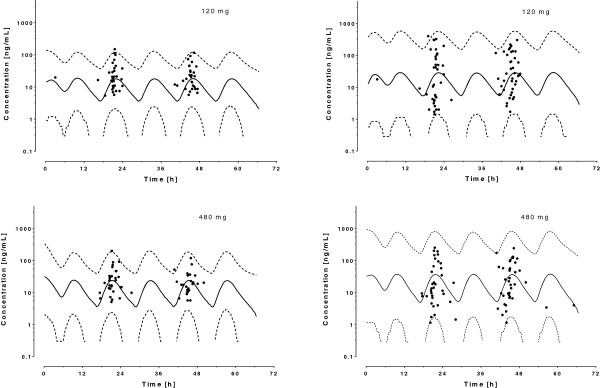
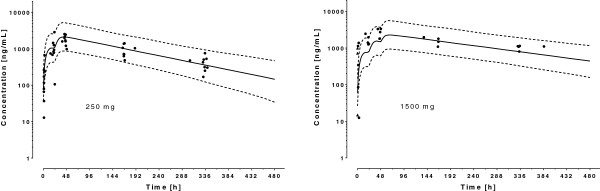
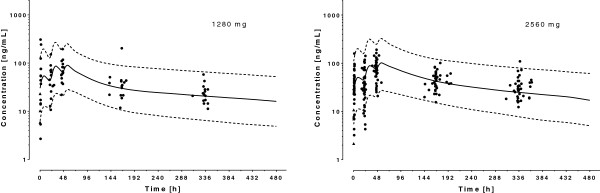
Background: Inter-individual variability in plasma concentration-time profiles might contribute to differences in anti-malarial treatment response. This study investigated the pharmacokinetics of three different forms of artemisinin combination therapy (ACT) in Tanzania and Cambodia to quantify and identify potential sources of variability.
Methods: Drug concentrations were measured in 143 patients in Tanzania (artemether, dihydroartemisinin, lumefantrine and desbutyl-lumefantrine), and in 63 (artesunate, dihydroartemisinin and mefloquine) and 60 (dihydroartemisinin and piperaquine) patients in Cambodia. Inter- and intra-individual variabilities in the pharmacokinetic parameters were assessed and the contribution of demographic and other covariates was quantified using a nonlinear mixed-effects modelling approach (NONMEM®).
Results: A one-compartment model with first-order absorption from the gastrointestinal tract fitted the data for all drugs except piperaquine (two-compartment). Inter-individual variability in concentration exposure was about 40% and 12% for mefloquine. From all the covariates tested, only body weight (for all antimalarials) and concomitant treatment (for artemether only) showed a significant influence on these drugs' pharmacokinetic profiles. Artesunate and dihydroartemisinin could not be studied in the Cambodian patients due to insufficient data-points. Modeled lumefantrine kinetics showed that the target day 7 concentrations may not be achieved in a substantial proportion of patients.
Conclusion: The marked variability in the disposition of different forms of ACT remained largely unexplained by the available covariates. Dosing on body weight appears justified. The concomitance of unregulated drug use (residual levels found on admission) and sub-optimal exposure (variability) could generate low plasma levels that contribute to selecting for drug-resistant parasites.
Figures


Similar articles
-
Optimizing the programmatic deployment of the anti-malarials artemether-lumefantrine and dihydroartemisinin-piperaquine using pharmacological modelling.Malar J. 2014 Apr 7;13:138. doi: 10.1186/1475-2875-13-138. Malar J. 2014. PMID: 24708571 Free PMC article.
-
Pharmacokinetic Interactions between Tafenoquine and Dihydroartemisinin-Piperaquine or Artemether-Lumefantrine in Healthy Adult Subjects.Antimicrob Agents Chemother. 2016 Nov 21;60(12):7321-7332. doi: 10.1128/AAC.01588-16. Print 2016 Dec. Antimicrob Agents Chemother. 2016. PMID: 27697758 Free PMC article. Clinical Trial.
-
Assessing the utility of an anti-malarial pharmacokinetic-pharmacodynamic model for aiding drug clinical development.Malar J. 2012 Aug 30;11:303. doi: 10.1186/1475-2875-11-303. Malar J. 2012. PMID: 22931058 Free PMC article.
-
Understanding the pharmacokinetics of Coartem.Malar J. 2009 Oct 12;8 Suppl 1(Suppl 1):S4. doi: 10.1186/1475-2875-8-S1-S4. Malar J. 2009. PMID: 19818171 Free PMC article. Review.
-
Pharmacokinetic profile of artemisinin derivatives and companion drugs used in artemisinin-based combination therapies for the treatment of Plasmodium falciparum malaria in children.Clin Pharmacokinet. 2013 Mar;52(3):153-67. doi: 10.1007/s40262-012-0026-5. Clin Pharmacokinet. 2013. PMID: 23288505 Review.
Cited by
-
Severe Acute Malnutrition Results in Lower Lumefantrine Exposure in Children Treated With Artemether-Lumefantrine for Uncomplicated Malaria.Clin Pharmacol Ther. 2019 Dec;106(6):1299-1309. doi: 10.1002/cpt.1531. Epub 2019 Jul 23. Clin Pharmacol Ther. 2019. PMID: 31152555 Free PMC article.
-
Malaria PK/PD and the Role Pharmacometrics Can Play in the Global Health Arena: Malaria Treatment Regimens for Vulnerable Populations.Clin Pharmacol Ther. 2021 Oct;110(4):926-940. doi: 10.1002/cpt.2238. Epub 2021 May 2. Clin Pharmacol Ther. 2021. PMID: 33763871 Free PMC article. Review.
-
Designing a Pediatric Study for an Antimalarial Drug by Using Information from Adults.Antimicrob Agents Chemother. 2015 Dec 28;60(3):1481-91. doi: 10.1128/AAC.01125-15. Antimicrob Agents Chemother. 2015. PMID: 26711749 Free PMC article. Clinical Trial.
-
How delayed and non-adherent treatment contribute to onward transmission of malaria: a modelling study.BMJ Glob Health. 2019 Dec 10;4(6):e001856. doi: 10.1136/bmjgh-2019-001856. eCollection 2019. BMJ Glob Health. 2019. PMID: 31908862 Free PMC article.
-
In vivo efficacy and safety of artemether-lumefantrine and amodiaquine-artesunate for uncomplicated Plasmodium falciparum malaria in Mozambique, 2018.Malar J. 2021 Oct 2;20(1):390. doi: 10.1186/s12936-021-03922-9. Malar J. 2021. PMID: 34600544 Free PMC article.
References
-
- WHO. Guidelines for the treatment of malaria. Second. Geneva: World Health Organization; 2010. - PubMed
-
- WHO. World Malaria Report 2011. Geneva: World Health Organization; 2011.
-
- Terlouw DJ, Nahlen BL, Courval JM, Kariuki SK, Rosenberg OS, Oloo AJ, Kolczak MS, Hawley WA, Lal AA, Kuile FO. Sulfadoxine-pyrimethamine in treatment of malaria in Western Kenya: increasing resistance and underdosing. Antimicrob Agents Chemother. 2003;47:2929–2932. doi: 10.1128/AAC.47.9.2929-2932.2003. - DOI - PMC - PubMed
Publication types
MeSH terms
Substances
LinkOut - more resources
Full Text Sources
Other Literature Sources
Medical
