. 2013 Jul 23;110(30):12373-8.
doi: 10.1073/pnas.1221104110. Epub 2013 Jul 10.

Male-specific region of the bovine Y chromosome is gene rich with a high transcriptomic activity in testis development

Affiliations

Male-specific region of the bovine Y chromosome is gene rich with a high transcriptomic activity in testis development

Ti-Cheng Chang et al. Proc Natl Acad Sci U S A. .

Erratum in

  • Proc Natl Acad Sci U S A. 2014 Feb 25;111(8):3195

Abstract

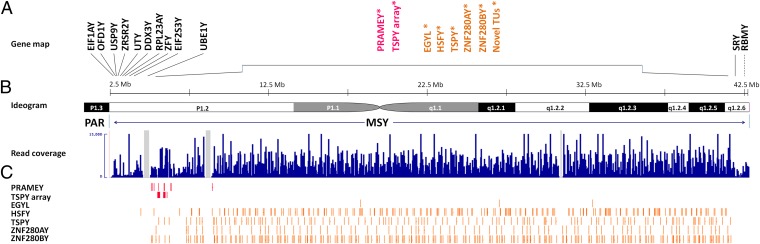
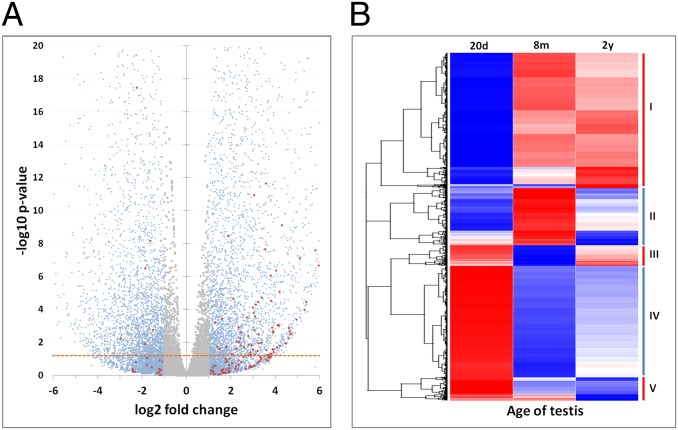
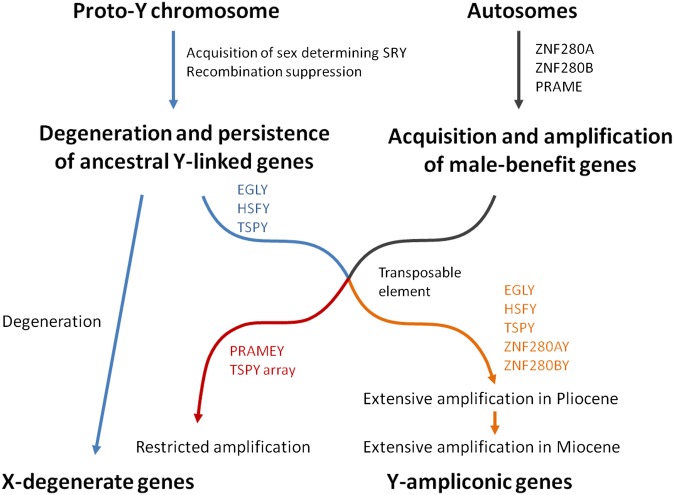
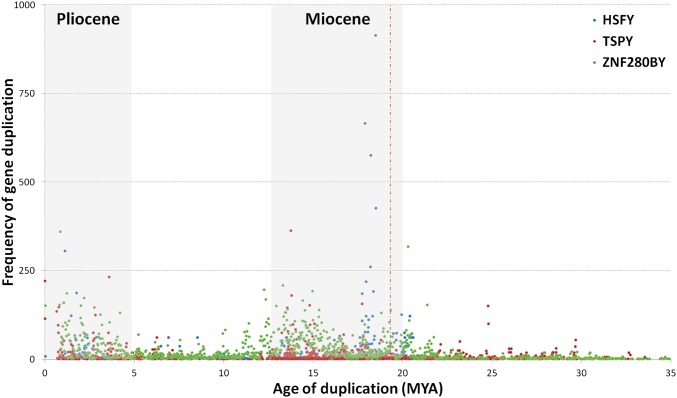
The male-specific region of the mammalian Y chromosome (MSY) contains clusters of genes essential for male reproduction. The highly repetitive and degenerative nature of the Y chromosome impedes genomic and transcriptomic characterization. Although the Y chromosome sequence is available for the human, chimpanzee, and macaque, little is known about the annotation and transcriptome of nonprimate MSY. Here, we investigated the transcriptome of the MSY in cattle by direct testis cDNA selection and RNA-seq approaches. The bovine MSY differs radically from the primate Y chromosomes with respect to its structure, gene content, and density. Among the 28 protein-coding genes/families identified on the bovine MSY (12 single- and 16 multicopy genes), 16 are bovid specific. The 1,274 genes identified in this study made the bovine MSY gene density the highest in the genome; in comparison, primate MSYs have only 31-78 genes. Our results, along with the highly transcriptional activities observed from these Y-chromosome genes and 375 additional noncoding RNAs, challenge the widely accepted hypothesis that the MSY is gene poor and transcriptionally inert. The bovine MSY genes are predominantly expressed and are differentially regulated during the testicular development. Synonymous substitution rate analyses of the multicopy MSY genes indicated that two major periods of expansion occurred during the Miocene and Pliocene, contributing to the adaptive radiation of bovids. The massive amplification and vigorous transcription suggest that the MSY serves as a genomic niche regulating male reproduction during bovid expansion.

Keywords: evolution; expression; gene amplification; transposition.


Conflict of interest statement

The authors declare no conflict of interest.

Figures

Fig. 1.
Fig. 1.
Transcriptional landscape of the bovine MSY. (A) A gene map of bMSY. X-degenerate single-copy genes or transcripts (black) are clustered at either end of the bMSY, whereas multicopy genes/transcripts (red and orange) are present in the majority of the bMSY. RBMY was missing from the draft assembly. The relative position of RBMY (dashed line) was determined based on a RH-mapping analysis. (Note: The copy numbers of each gene or TU family are detailed in Table S1.) (B) The alignment of deep sequencing reads from the direct cDNA selection. About 80.9% of bMSY genes are transcriptionally active. The scale on the top of the ideogram is based on the BTAY draft assembly. The gray bars represent gaps in the assembly. (C) The predicted loci of six protein-coding, multicopy gene families. The PRAMEY gene family and the TSPY array (red) were amplified in a confined region (∼5 Mb) near the boundary between the X-degenerate and ampliconic regions, representing a transitional region with a peculiar genomic context.
Fig. 2.
Fig. 2.
Expression of the bovine MSY genes/transcripts in testes. (A) Volcano plot of the differential gene expression between 20d and 2y testes. A total of 106 BTAY genes or TUs were found to be differentially expressed. The x-axis represents log twofold change; the y-axis represents −log10 (P ≤ 20). The genes, including HSFY and ZNF280BY, with a −log10 P value >20 are excluded from the plot. The red dots represent Y-chromosome–linked genes or TUs. Blue dots represent autosomal and X-chromosome–linked genes. The dashed orange line indicates P = 0.05; dots above the line have P < 0.05. The genes or TUs with a fold-change <2 are shown in gray. (B) Clustering and heatmap of differentially expressed Y-chromosome–linked genes or TUs. A hierarchical clustering of the differentially expressed genes revealed five major patterns (I–V). The heatmap of differentially expressed genes based on clustering is shown, in which each column represents the age of testis (20d, 8m, or 2y), and each row represents a gene or TU. Data were normalized to z-scores between −1 and 1 for each gene or TU. Red and blue indicate an increase or decrease, respectively, in gene expression compared with the universal mean (white) for each gene or TU. The differentially expressed bMSY genes or TUs were clustered mainly in pattern I, which is up-regulated in 8m/2y testes relative to 20d testes. Pattern II genes or TUs have the highest expression; pattern III has the lowest expression in 8m testis. In contrast to pattern I, the genes or TUs in patterns IV and V were down-regulated. GO enrichment analyses for each pattern are detailed in Table S3.
Fig. 3.
Fig. 3.
The evolutionary model of the bovine Y chromosome. The bovine Y chromosome evolved from a pair of ancestral autosomes. Genes on the BTAY originated through two major evolutionary paths. First, the X-degenerate genes evolved through gradual differentiation of the Y chromosome from the X chromosome, as explained by the addition and attrition theory (2). Second, selection forces facilitated the acquisition of autosomal, male-beneficial genes by the BTAY, in which the transposable elements have acted for the movement and amplification of the bMSY genes. The amplification occurred in both X-degenerate genes (EGLY, TSPY, and HSFY) and genes acquired from autosomes (ZNF280AY, ZNF280BY, and PRAMEY). Two subpaths diverged as a result of different strengths of gene amplification, in which TSPY, HSFY, ZNF280AY, and ZNF280BY were amplified extensively. The extensive amplification of the bMSY genes in the Pliocene and Miocene is associated with the adaptive diversification of Bovidae (see text and Fig. 4).
Fig. 4.
Fig. 4.
Age distribution of the paralogs in the bovine TSPY, HSFY, and ZNF280BY gene families. Pair-wise Ks values for all loci of the bovine TSPY, HSFY, and ZNF280BY gene families were calculated, and the gene duplication times were estimated. The gene duplication frequencies (y-axis) were plotted against the age of the gene duplication (x-axis). The plot displays a bimodal distribution with peaks falling into two major time periods, 0–5 and 14–20 Mya (highlighted in gray), corresponding to the Pliocene and Miocene epochs, respectively. The red dashed line denotes the divergence of sheep and cattle, around 19.2 Mya.

Comment in

Similar articles

Cited by

References

    1. Quintana-Murci L, Fellous M. The human Y chromosome: The biological role of a “functional wasteland”. J Biomed Biotechnol. 2001;1(1):18–24. - PMC - PubMed
    1. Graves JA. Evolution of the mammalian Y chromosome and sex-determining genes. J Exp Zool. 1998;281(5):472–481. - PubMed
    1. Skaletsky H, et al. The male-specific region of the human Y chromosome is a mosaic of discrete sequence classes. Nature. 2003;423(6942):825–837. - PubMed
    1. Paria N, et al. A gene catalogue of the euchromatic male-specific region of the horse Y chromosome: Comparison with human and other mammals. PLoS ONE. 2011;6(7):e21374. - PMC - PubMed
    1. Murphy WJ, et al. Novel gene acquisition on carnivore Y chromosomes. PLoS Genet. 2006;2(3):e43. - PMC - PubMed

Publication types