

doi: 10.1038/psp.2013.30.
The impact of mathematical modeling on the understanding of diabetes and related complications
Affiliations
- PMID: 23842097
- PMCID: PMC3731829
- DOI: 10.1038/psp.2013.30
Item in Clipboard
The impact of mathematical modeling on the understanding of diabetes and related complications
CPT Pharmacometrics Syst Pharmacol.
.
Abstract
Diabetes is a chronic and complex multifactorial disease caused by persistent hyperglycemia and for which underlying pathogenesis is still not completely understood. The mathematical modeling of glucose homeostasis, diabetic condition, and its associated complications is rapidly growing and provides new insights into the underlying mechanisms involved. Here, we discuss contributions to the diabetes modeling field over the past five decades, highlighting the areas where more focused research is required.CPT: Pharmacometrics & Systems Pharmacology (2013) 2, e54; doi:10.1038/psp.2013.30; advance online publication 10 July 2013.
Figures
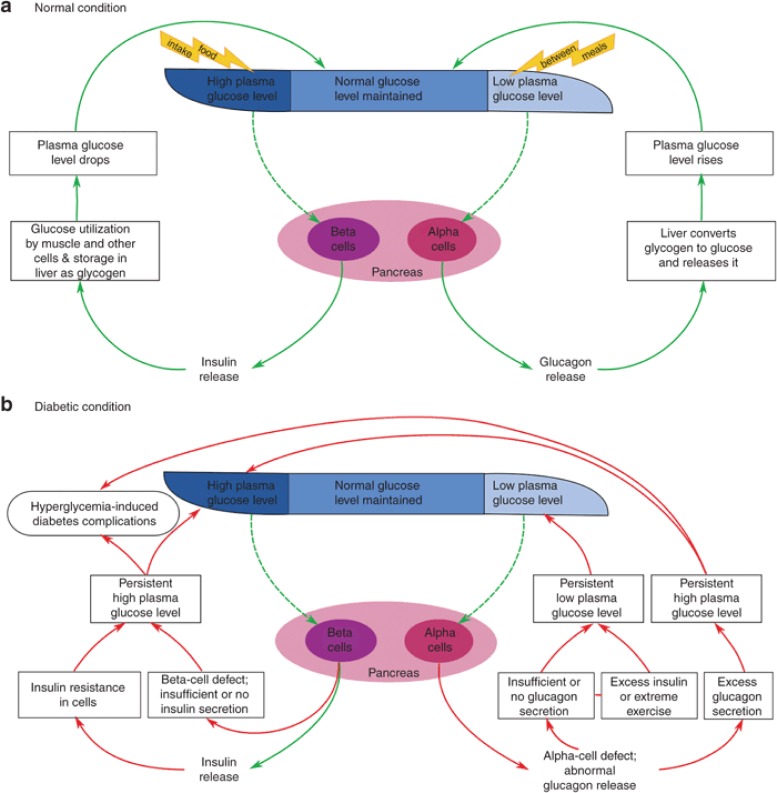
General overview of the glucose homeostasis mechanism under normal and diabetic condition. Plasma glucose level is maintained within a narrow range through the combined antagonistic action of two pancreatic hormones: insulin and glucagon. (a) In normal individuals, high plasma glucose level induces the release of insulin from pancreatic β-cells, which enables the muscle and other cells to take up glucose for energy or to store it as glycogen in liver. On the other hand, at low plasma glucose level, glucagon secreted from α-cells counterregulates the glucose level by inducing the breakdown of glycogen into glucose. (b) In diabetic individuals, the synchronized mechanism between insulin and glucagon secretion is disrupted. Insufficient or lack of insulin production by β-cells, or insulin sensitivity in muscle and other cells, leads to persistent high plasma glucose level (hyperglycemia). This condition is often accompanied by absolute or relative excess level of glucagon, which causes a higher rate of hepatic glucose production than utilization, favoring hyperglycemia (S123–S125). Another defect that is seen in diabetic patients is the impaired secretory response of α-cells to release glucagon when the plasma glucose level drops, leading to the risk of episodes of severe hypoglycemia (S126). This often occurs due to exposure to excess insulin during treatment or to extreme physical activities carried out as part of self-management, accompanied with compromised glucose counterregulation (see Supplementary Data online, for details).
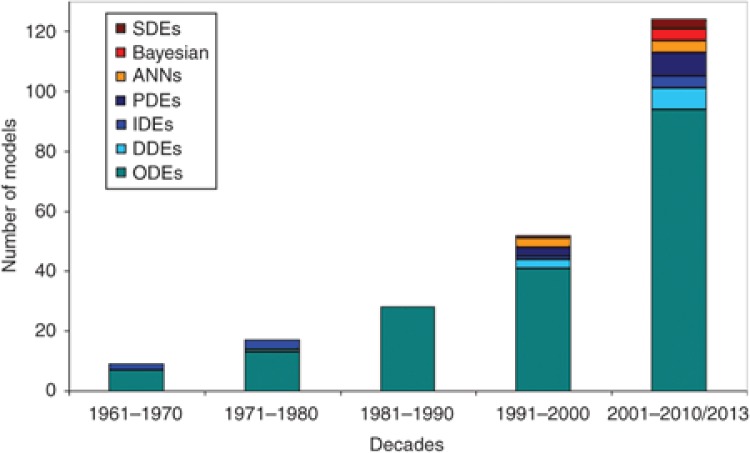
Modeling approaches vs. the number of models in relation to diabetes and associated complications, over the past five decades. There has been a significant increase in the number of models, as well as in the diversity of the modeling approaches applied toward addressing diabetes. ANNs, artificial neural networks; DDEs, delay differential equations; IDEs, integro-differential equations; ODEs, ordinary differential equations; PDEs, partial differential equations; SDEs, stochastic differential equations.
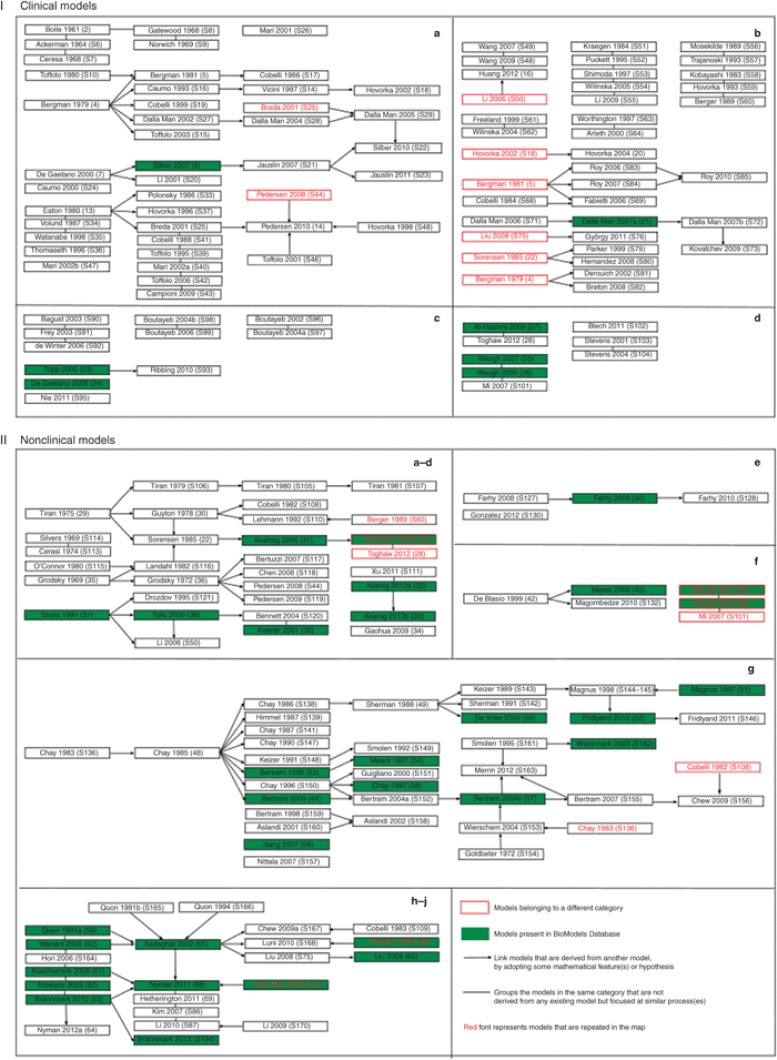
Model relationship map. Models that describe diverse aspects of glucose homeostasis and diabetes are broadly classified into clinical (I) and nonclinical (II) models based on the data used, the level of complexity, and the biological description. Within each of these categories, these models are further subclassified based on the purpose for which they are developed and the physiological scale utilized in the models. The subclassification of models are as follows: I-a, diagnosis; I-b, control; I-c, progression; I-d, complications; II-a, whole-body insulin–glucose dynamics; II-b, hepatic glucose dynamics; II-c, brain glucose dynamics; II-d, beta-cell insulin release; II-e, glucagon dynamics; II-f, macrophage action; II-g, beta-cell electrophysiology; II-h, insulin receptor dynamics; II-i, insulin signaling; II-j, multiscale/level hierarchical models. A landscape of how the different models are related and evolve from each other is shown. The models are named with the first author's surname followed by the year of publication and the reference number. The models that are highlighted in green are available in BioModels Database. The arrow (→) is used to link models that are derived/adopted from one or more parent models. In other words, these models share common structures or equations. The line (—) is used to link models representing similar biological phenomenon but that are not derived from any other models. Models that are listed without any connections belong to the corresponding subclass, but do not share significant common components. The models that are repeated (models that fit in more than one subclass) more than once are displayed in red fonts. Models that are boxed red belong to a different category but are displayed as they serve as base models in the existing category. Reference numbers with prefix S can be found in Supplementary Data online. The figure illustrates the importance of sharing and reuse of mathematical models, to leverage on past work.
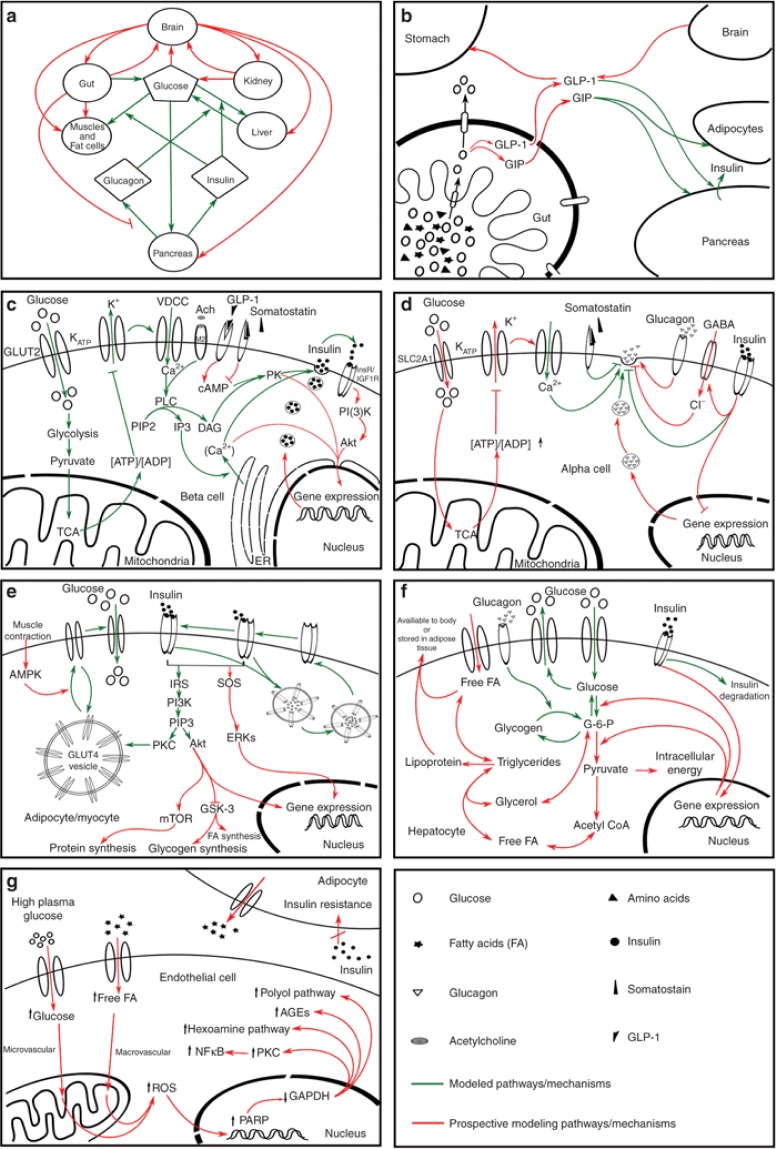
Diagrammatic representation of the pathways involved in the maintenance of glucose homeostasis (a–f) and hyperglycemia-induced tissue damage pathway (g) at different biological scales (i.e., molecular, cellular, and physiological level). (a) Whole-body glucose homeostasis, (b) glucose absorption from gut, (c) glucose-stimulated insulin secretion by pancreatic β-cells, (d) glucose-mediated glucagon secretion and regulation, (e) insulin-dependent uptake of glucose in adipocytes and myocytes, (f) utilization and storage of glucose as lipid and glycogen in liver, and (g) hyperglycemia-induced tissue damage pathway, which is the cause of diverse diabetic complications. The figure illustrates a simplified representation of the pathways involved at molecular, cellular, and physiological levels. Connectors in red indicate prospective pathways for mathematical modeling while green indicates the previously modeled pathways. It should be noted that pathways denoted in green in each box do not necessarily represent a single model. Rather, they should be seen as a collection of models aimed at addressing these pathways. This figure highlights pathways that need to be targeted by future modeling studies. For detailed explanation of this figure, see Supplementary Data online.
Similar articles
-
CPT: Pharmacometrics and Systems Pharmacology.CPT Pharmacometrics Syst Pharmacol. 2012 Sep 26;1(9):e8. doi: 10.1038/psp.2012.8. CPT Pharmacometrics Syst Pharmacol. 2012. PMID: 23835888 Free PMC article.
-
Cardiovascular disease: the other face of diabetes.CPT Pharmacometrics Syst Pharmacol. 2013 Oct 23;2(10):e81. doi: 10.1038/psp.2013.57. CPT Pharmacometrics Syst Pharmacol. 2013. PMID: 24153424 Free PMC article.
-
Basic concepts in population modeling, simulation, and model-based drug development.CPT Pharmacometrics Syst Pharmacol. 2012 Sep 26;1(9):e6. doi: 10.1038/psp.2012.4. CPT Pharmacometrics Syst Pharmacol. 2012. PMID: 23835886 Free PMC article.
-
Mathematical Modeling for the Physiological and Clinical Investigation of Glucose Homeostasis and Diabetes.Front Physiol. 2020 Nov 25;11:575789. doi: 10.3389/fphys.2020.575789. eCollection 2020. Front Physiol. 2020. PMID: 33324238 Free PMC article. Review.
-
Pharmacometrics: The Already-Present Future of Precision Pharmacology.Ther Innov Regul Sci. 2023 Jan;57(1):57-69. doi: 10.1007/s43441-022-00439-4. Epub 2022 Aug 18. Ther Innov Regul Sci. 2023. PMID: 35984633 Review.
Cited by
-
A mechanistic modeling platform of SGLT2 inhibition: Implications for type 1 diabetes.CPT Pharmacometrics Syst Pharmacol. 2023 Jun;12(6):831-841. doi: 10.1002/psp4.12956. Epub 2023 Mar 16. CPT Pharmacometrics Syst Pharmacol. 2023. PMID: 36912425 Free PMC article.
-
Implementation of quantitative and systems pharmacology in large pharma.CPT Pharmacometrics Syst Pharmacol. 2014 Oct 22;3(10):e142. doi: 10.1038/psp.2014.40. CPT Pharmacometrics Syst Pharmacol. 2014. PMID: 25338195 Free PMC article. Review.
-
A comprehensive compartmental model of blood glucose regulation for healthy and type 2 diabetic subjects.Med Biol Eng Comput. 2016 Sep;54(9):1383-98. doi: 10.1007/s11517-015-1406-4. Epub 2015 Oct 22. Med Biol Eng Comput. 2016. PMID: 26493377
-
Glucose Homeostatic Law: Insulin Clearance Predicts the Progression of Glucose Intolerance in Humans.PLoS One. 2015 Dec 1;10(12):e0143880. doi: 10.1371/journal.pone.0143880. eCollection 2015. PLoS One. 2015. PMID: 26623647 Free PMC article.
-
A Simple Mathematical Model for Wound Closure Evaluation.J Am Coll Clin Wound Spec. 2016 Jul 29;7(1-3):40-49. doi: 10.1016/j.jccw.2016.07.002. eCollection 2015 Dec. J Am Coll Clin Wound Spec. 2016. PMID: 28053868 Free PMC article.
References
-
- Bolie V.W. Coefficients of normal blood glucose regulation. J. Appl. Physiol. 1961;16:783–788. - PubMed
-
- Bergman R.N., Ider Y.Z., Bowden C.R., Cobelli C. Quantitative estimation of insulin sensitivity. Am. J. Physiol. 1979;236:E667–E677. - PubMed
-
- Bergman R.N., et al. Assessment of insulin sensitivity in vivo: a critical review. Diabetes. Metab. Rev. 1989;5:411–429. - PubMed
LinkOut - more resources
Full Text Sources
Other Literature Sources
Miscellaneous
