

Left behind: widening disparities for males and females in US county life expectancy, 1985-2010
- PMID: 23842281
- PMCID: PMC3717281
- DOI: 10.1186/1478-7954-11-8
Left behind: widening disparities for males and females in US county life expectancy, 1985-2010
Abstract
Background: The United States spends more than any other country on health care. The poor relative performance of the US compared to other high-income countries has attracted attention and raised questions about the performance of the US health system. An important dimension to poor national performance is the large disparities in life expectancy.
Methods: We applied a mixed effects Poisson statistical model and Gaussian Process Regression to estimate age-specific mortality rates for US counties from 1985 to 2010. We generated uncertainty distributions for life expectancy at each age using standard simulation methods.
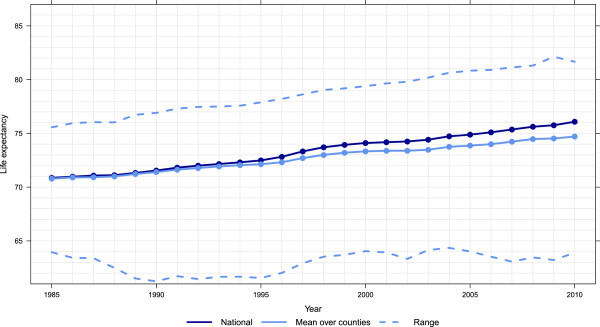
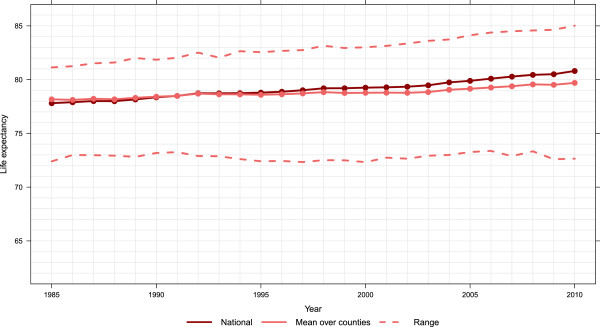
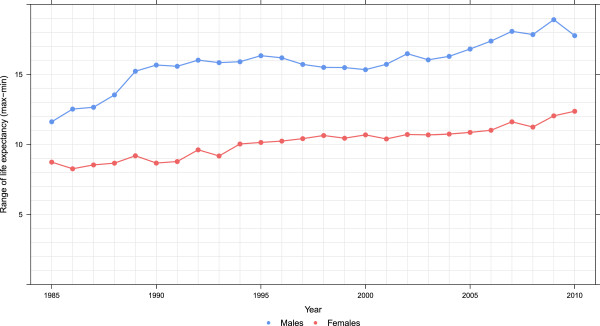
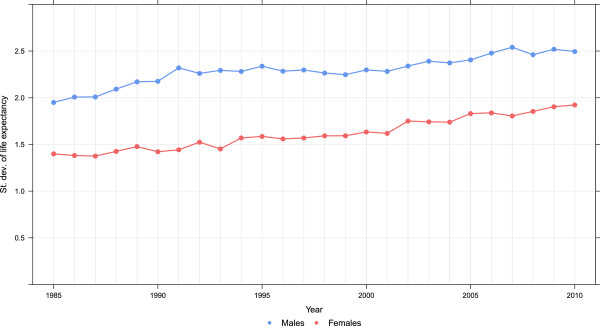
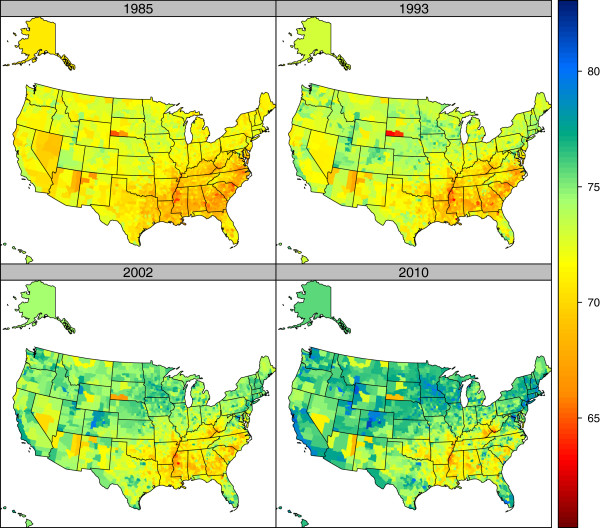
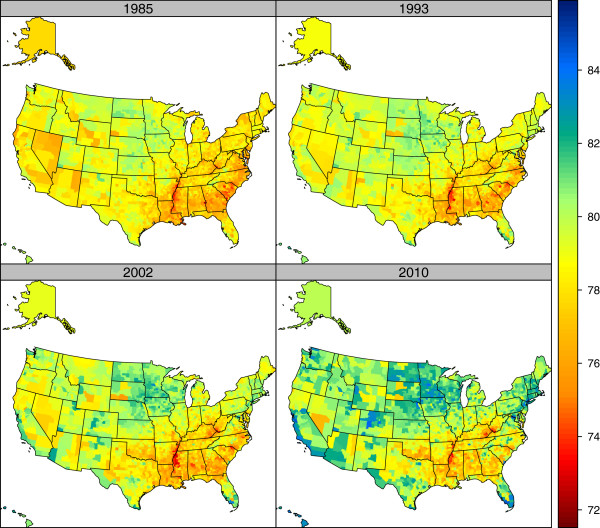
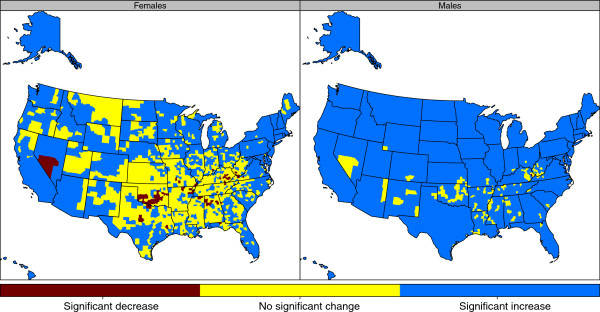
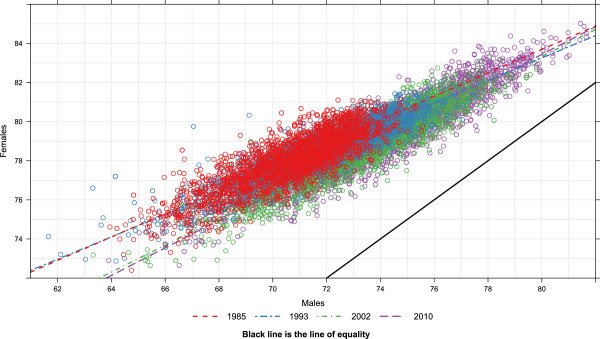
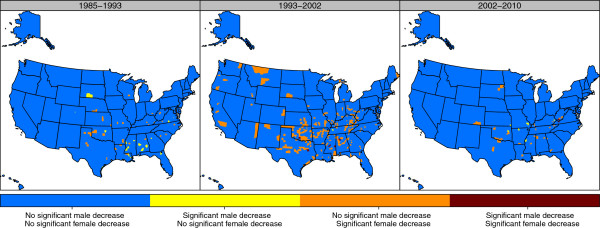
Results: Female life expectancy in the United States increased from 78.0 years in 1985 to 80.9 years in 2010, while male life expectancy increased from 71.0 years in 1985 to 76.3 years in 2010. The gap between female and male life expectancy in the United States was 7.0 years in 1985, narrowing to 4.6 years in 2010. For males at the county level, the highest life expectancy steadily increased from 75.5 in 1985 to 81.7 in 2010, while the lowest life expectancy remained under 65. For females at the county level, the highest life expectancy increased from 81.1 to 85.0, and the lowest life expectancy remained around 73. For male life expectancy at the county level, there have been three phases in the evolution of inequality: a period of rising inequality from 1985 to 1993, a period of stable inequality from 1993 to 2002, and rising inequality from 2002 to 2010. For females, in contrast, inequality has steadily increased during the 25-year period. Compared to only 154 counties where male life expectancy remained stagnant or declined, 1,405 out of 3,143 counties (45%) have seen no significant change or a significant decline in female life expectancy from 1985 to 2010. In all time periods, the lowest county-level life expectancies are seen in the South, the Mississippi basin, West Virginia, Kentucky, and selected counties with large Native American populations.
Conclusions: The reduction in the number of counties where female life expectancy at birth is declining in the most recent period is welcome news. However, the widening disparities between counties and the slow rate of increase compared to other countries should be viewed as a call for action. An increased focus on factors affecting health outcomes, morbidity, and mortality such as socioeconomic factors, difficulty of access to and poor quality of health care, and behavioral, environmental, and metabolic risk factors is urgently required.
Figures
References
-
- Wang H, Dwyer-Lindgren L, Lofgren KT, Rajaratnam JK, Marcus JR, Levin-Rector A, Levitz CE, Lopez AD, Murray CJ. Age-specific and sex-specific mortality in 187 countries, 1970–2010: a systematic analysis for the global burden of disease study 2010. Lancet. 2012;380:2071–2094. doi: 10.1016/S0140-6736(12)61719-X. - DOI - PubMed
-
- Peterson CL, Rachel B. US Health Care Spending: Comparison with Other OECD Countries. Washington, DC: Congressional Research Service Federal Publications; 2007.
LinkOut - more resources
Full Text Sources
Other Literature Sources
Miscellaneous
