. 2013:4:2139.
doi: 10.1038/ncomms3139.

Landscape of the mitochondrial Hsp90 metabolome in tumours

Affiliations

Landscape of the mitochondrial Hsp90 metabolome in tumours

Young Chan Chae et al. Nat Commun. 2013.

Erratum in

  • Corrigendum: Landscape of the mitochondrial Hsp90 metabolome in tumours.
    Chae YC, Angelin A, Lisanti S, Kossenkov AV, Speicher KD, Wang H, Powers JF, Tischler AS, Pacak K, Fliedner S, Michalek RD, Karoly ED, Wallace DC, Languino LR, Speicher DW, Altieri DC. Chae YC, et al. Nat Commun. 2015 Jun 18;6:7605. doi: 10.1038/ncomms8605. Nat Commun. 2015. PMID: 26085380 Free PMC article. No abstract available.

Abstract

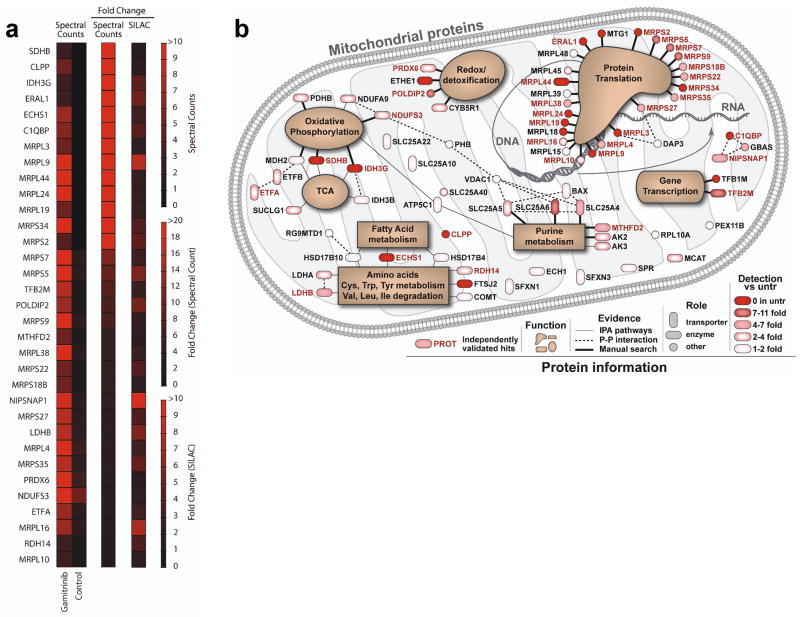
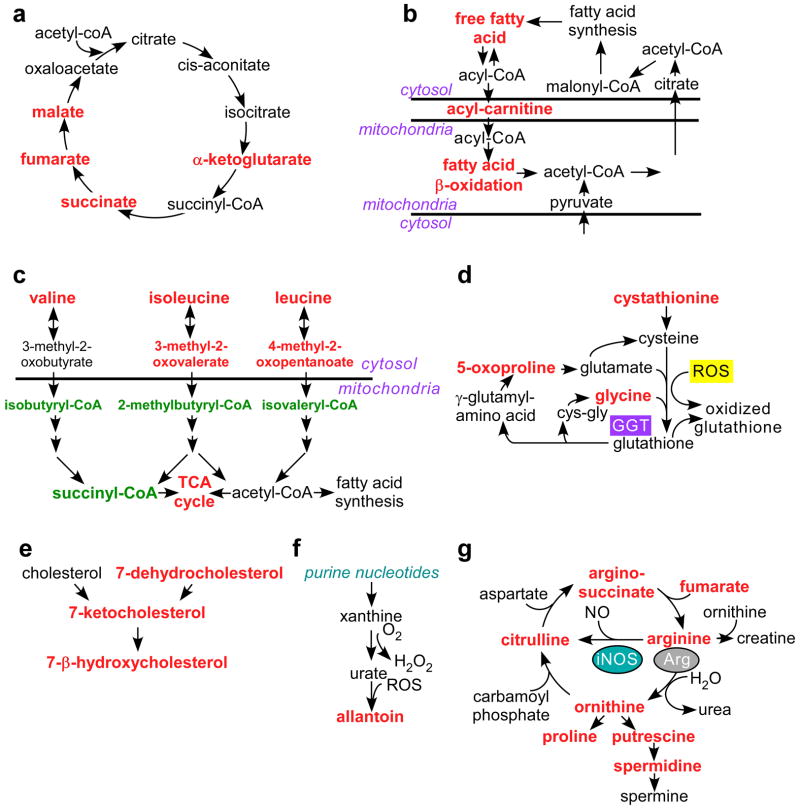
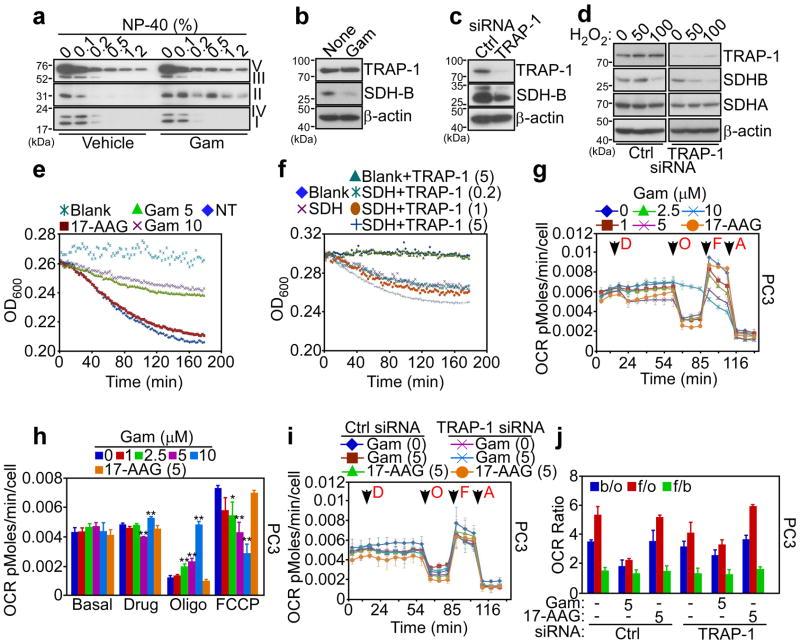
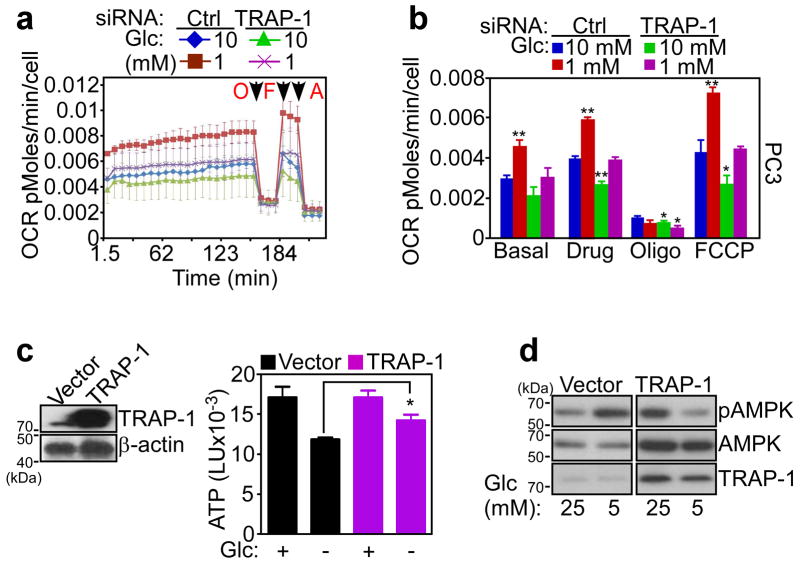
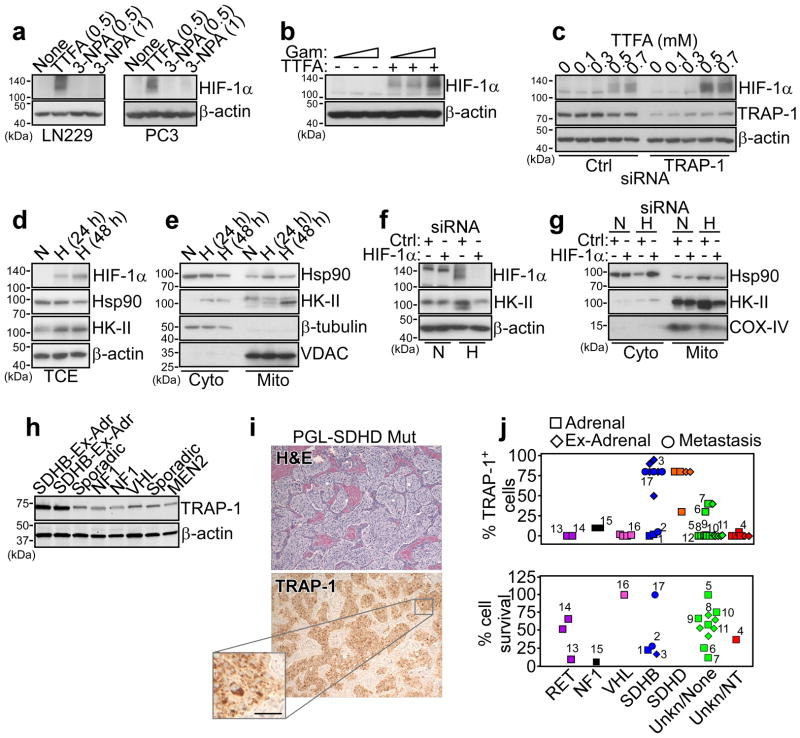
Reprogramming of tumour cell metabolism contributes to disease progression and resistance to therapy, but how this process is regulated on the molecular level is unclear. Here we report that heat shock protein 90-directed protein folding in mitochondria controls central metabolic networks in tumour cells, including the electron transport chain, citric acid cycle, fatty acid oxidation, amino acid synthesis and cellular redox status. Specifically, mitochondrial heat shock protein 90, but not cytosolic heat shock protein 90, binds and stabilizes the electron transport chain Complex II subunit succinate dehydrogenase-B, maintaining cellular respiration under low-nutrient conditions, and contributing to hypoxia-inducible factor-1α-mediated tumorigenesis in patients carrying succinate dehydrogenase-B mutations. Thus, heat shock protein 90-directed proteostasis in mitochondria regulates tumour cell metabolism, and may provide a tractable target for cancer therapy.


Conflict of interest statement

AUTHOR CONTRIBUTIONS

Y.C.C., A.A., A.S.T., R.D.M., D.C.W., L.R.L., D.W.S., and D.C.A. designed research; Y.C.C., A.A., K.D.S., H.W., J.F.P., and E.D.K. performed research; S.L., K.P., S.F. and R.D.M. contributed new reagents/analytical tools; Y.C.C., A.A., A.S.T., R.D.M., D.C.W., L.R.L., D.W.S., and D.C.A. analyzed data, and Y.C.C., A.A., A.S.T., D.C.W., D.W.S., and D.C.A. wrote the paper.

COMPETING FINANCIAL INTEREST

The authors declare no competing financial interest.

Figures

Figure 1
Figure 1. Mitochondrial Hsp90 proteome
(a) LN229 cells were treated with vehicle (Control) or non-cytotoxic concentrations of mitochondrial-targeted Hsp90 inhibitor, Gamitrinib, and detergent-insoluble mitochondrial proteins were identified by 1-D Mass Spectrometry (spectral counts), or, alternatively, by SILAC technology. The heat map quantifies changes in protein solubility (>3-fold cutoff) between the treatments assessed using the two independent proteomics approaches. (b) Schematic representation of the mitochondrial Hsp90 proteome. Proteins are annotated with functions based on literature search and information from Ingenuity software, which was also used to determine known direct protein-protein interactions. All proteins are color coded to reflect the magnitude of difference in detection between treated and untreated (untr) samples. Proteins marked in ‘red’ exhibited a >3-fold change difference after Gamitrinib treatment compared to control, and were independently confirmed by both 1-D Mass Spectrometry and SILAC technology.
Figure 2
Figure 2. Mitochondrial Hsp90 control of tumor cell metabolism
PC3 cells were transfected with control non-targeting siRNA or TRAP-1-directed siRNA, or, alternatively, treated with non-cytotoxic concentrations of 17-AAG (5 μM) or Gamitrinib (2.5–5 μM), and analyzed for changes in expression of 301 individual metabolites by Mass Spectrometry. The complete summary of metabolic changes induced by targeting mitochondrial Hsp90s is presented in Supplementary Data 2. The experiment was carried out once with 5 independent replicates per condition tested. The metabolic pathways affected under these conditions are depicted as follows: (a) Citric acid cycle; (b) Fatty acid oxidation; (c) Branched chain amino acid catabolism; (d) Redox status; (e) Cholesterol metabolism; (f) Purine nucleotide metabolism; and (g) Arginine metabolism. Significant (p<0.05) changes in metabolite levels within each group (Ctrl vs. TRAP-1 siRNA or vehicle vs. Gamitrinib) are indicated in red (increase) or green (decrease) using Welch’s two-sample t-test (n=5).
Figure 3
Figure 3. Mitochondrial Hsp90 regulation of cellular respiration
(a) PC3 cells were treated with vehicle or Gamitrinib (Gam), solubilized in the indicated increasing concentrations of detergent (NP-40), and insoluble proteins were analyzed by Western blotting with an antibody cocktail to the OXPHOS complex. (b, c) PC3 cells were treated with Gamitrinib (b) or transfected with control non-targeting siRNA (Ctrl) or TRAP-1-directed siRNA (c), and analyzed by Western blotting. None, untreated. (d) PC3 cells were transfected as in (c), treated with the indicated increasing concentrations of H2O2 (μM), and analyzed by Western blotting. (e) PC3 cells were treated with the indicated concentrations of Gamitrinib (Gam, μM) or 17-AAG (10 μM) and analyzed for SDHB activity at the indicated time intervals. NT, not treated. (f) Endogenous Complex II (SDH) was immunoprecipitated from PC3 cells, and analyzed for SDHB activity in the presence of increasing concentrations of recombinant TRAP-1 (μM). Data for panels (e, f) are from representative experiments out of at least two independent determinations. (g) PC3 cells were treated with 17-AAG (5 μM) or the indicated increasing concentrations of Gamitrinib (Gam, μM) and the oxygen consumption rate (OCR) was measured in real time under basal condition and in response to the indicated inhibitors. Arrows indicate the time of drug addition: D, Gamitrinib (Gam) or 17-AAG; O, oligomicyin (1.25 μM); F, FCCP (0.4 μM); A, antimycin (1.8 μM). (h) The OCR was normalized by the number of cells, and the extra-mitochondrial respiration after addition of antimycin was subtracted as background. * p<0.05; ** p<0.01 vs control sample at each state (two-sided unpaired t test). (i) PC3 cells were transfected with control (Ctrl) siRNA or TRAP-1-directed siRNA, treated with Gamitrinib (Gam, μM) or 17-AAG and analyzed for OCR as in (g). (j). Quantification of OCR ratio between: b/o, basal condition (before any addition) and after oligomycin addition; f/o, after FCCP and oligomycin addition; f/b, after FCCP addition and basal condition in PC3 cells transfected with control siRNA (Ctrl) or TRAP-1-directed siRNA. * p<0.05; ** p<0.01 (two-sided unpaired t test). For all OCR experiments, data are representative of two independent experiments carried out in triplicate, mean±sd
Figure 4
Figure 4. Mitochondrial Hsp90 regulation of stress bioenergetics
(a) PC3 cells were transfected with control, non-targeting siRNA (Ctrl) or TRAP-1-directed siRNA and maintained in 1 or 10 mM glucose (Glc) for 3 h before analysis of OCR. Arrows indicate the time of drug addition: O, oligomicyin (1.25 μM); F, FCCP (0.4 μM); A, antimycin (1.8 μM). (b) OCR in a was quantified in siRNA-transfected cells in different glucose (Glc) concentrations. Data for panels (a, b) data are representative of two independent experiments carried out in triplicate, mean±sd. * p<0.05; ** p<0.01 vs control sample at each state (two-sided unpaired t test). (c) Normal NIH3T3 fibroblasts were transfected with control vector or TRAP-1 cDNA and analyzed by Western blotting (left) or ATP production in the presence (+) or absence (−) of glucose (Glc, 25 mM) (right). *, p=0.03 (two-sided unpaired t test). (d) NIH3T3 fibroblasts were transfected as in (c), incubated with the indicated concentrations of glucose (Glc, mM), and analyzed by Western blotting. p, phosphorylated.
Figure 5
Figure 5. TRAP-1-SDHB complex regulates HIF-1α-directed tumorigenesis
(a) The indicated tumor cell types (LN229 or PC3 cells) were treated with the various concentrations (mM) of the SDHB inhibitors, TTFA or 3-NPA and analyzed by Western blotting. (b) PC3 cells were treated with increasing concentrations of Gamitrinib (Gam, 0, 2.5, 5 μM) in the absence (−) or presence (+) of TTFA (0.3 mM) and analyzed by Western blotting. (c) LN229 cells were transfected with control siRNA (Ctrl) or TRAP-1-directed siRNA and analyzed by Western blotting in the presence of the indicated increasing concentrations of TTFA. (d, e) PC3 cells were maintained under conditions of hypoxia (H, 0.5% O2, 5% CO2, 94% N2 for 24 h) or normoxia (N), and analyzed by Western blotting in total cell extracts (TCE) (d), or fractionated cytosolic (Cyto) or mitochondrial (Mito) extracts (e). VDAC or β-tubulin was used as a mitochondrial or cytosolic marker, respectively. (f) PC3 cells were transfected with control siRNA (Ctrl) or HIF-1α-directed siRNA, maintained in normoxia (N) or hypoxia (H) conditions, and analyzed by Western blotting. (g) PC3 cells were transfected and treated as in (f), and isolated cytosolic (Cyto) or mitochondrial (Mito) fractions were analyzed by Western blotting. COX-IV was used as a mitochondrial marker. (h) Patient-derived tissue samples of PCC/PGL were analyzed by Western blotting. The mutational status of each tumor is indicated. Ex-Adr, extra-adrenal localization. (i) A tissue sample of extra-adrenal PGL with SDHD mutation, showing a typical nest-like (“Zellballen”) growth pattern was stained with hematoxylin/eosin (H&E, top) or TRAP-1 (bottom), by immunohistochemistry. Scale bar, 50 μm. (j) Quantification of immunohistochemical expression of TRAP-1 in PCC/PGL cases with the indicated mutational status (top). Cells from the various tumor samples were maintained in culture and analyzed for killing by Gamitrinib (10 μM for two weeks) (bottom) measured by counts of tyrosine hydroxylase-positive cells counted in an area defined by a randomly placed 22×22 mm square coverslips in 35 mm round culture dishes. Each point represents a single tumor. Paired samples of the same tumor were available in 12 instances and are indicated by matching numbers. Data are from a representative experiment.

References

    1. Kroemer G, Pouyssegur J. Tumor Cell Metabolism: Cancer’s Achilles’ Heel. Cancer Cell. 2008;13:472–482. - PubMed
    1. Vander Heiden MG, Cantley LC, Thompson CB. Understanding the Warburg effect: the metabolic requirements of cell proliferation. Science. 2009;324:1029–1033. - PMC - PubMed
    1. Koppenol WH, Bounds PL, Dang CV. Otto Warburg’s contributions to current concepts of cancer metabolism. Nat Rev Cancer. 2011;11:325–337. - PubMed
    1. Gao P, et al. c-Myc suppression of miR-23a/b enhances mitochondrial glutaminase expression and glutamine metabolism. Nature. 2009;458:762–765. - PMC - PubMed
    1. Matoba S, et al. p53 regulates mitochondrial respiration. Science. 2006;312:1650–1653. - PubMed

Publication types

MeSH terms