

Translational sensitivity of the Escherichia coli genome to fluctuating tRNA availability
- PMID: 23842674
- PMCID: PMC3783181
- DOI: 10.1093/nar/gkt602
Translational sensitivity of the Escherichia coli genome to fluctuating tRNA availability
Abstract
The synthesis of protein from messenger RNA during translation is a highly dynamic process that plays a key role in controlling the efficiency and fidelity of genome-wide protein expression. The availability of aminoacylated transfer RNA (tRNA) is a major factor influencing the speed of ribosomal movement, which depending on codon choices, varies considerably along a transcript. Furthermore, it has been shown experimentally that tRNA availability can vary significantly under different growth and stress conditions, offering the cell a way to adapt translational dynamics across the genome. Existing models of translation have neglected fluctuations of tRNA pools, instead assuming fixed tRNA availabilities over time. This has lead to an incomplete understanding of this process. Here, we show for the entire Escherichia coli genome how and to what extent translational speed profiles, which capture local aspects of translational elongation, respond to measured shifts in tRNA availability. We find that translational profiles across the genome are affected to differing degrees, with genes that are essential or related to fundamental processes such as translation, being more robust than those linked to regulation. Furthermore, we reveal how fluctuating tRNA availability influences profiles of specific sequences known to play a significant role in translational control of gene expression.
Figures
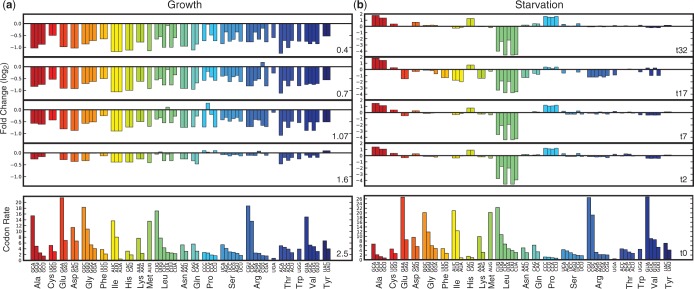
 . During leucine starvation, both decreases and increases in codon rates are observed (e.g. codons for proline, histidine, alanine).
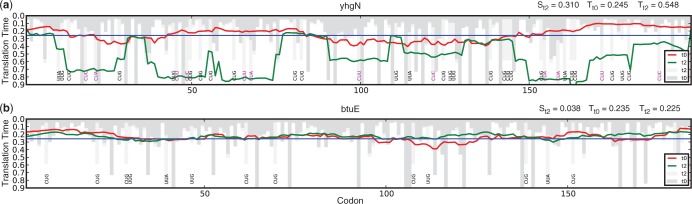
 denotes the sensitivity value and
  the average translation time under the respective condition c.
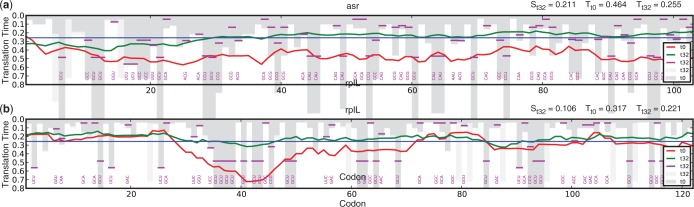
 denotes the sensitivity value and
  the average translation time under the respective condition c.
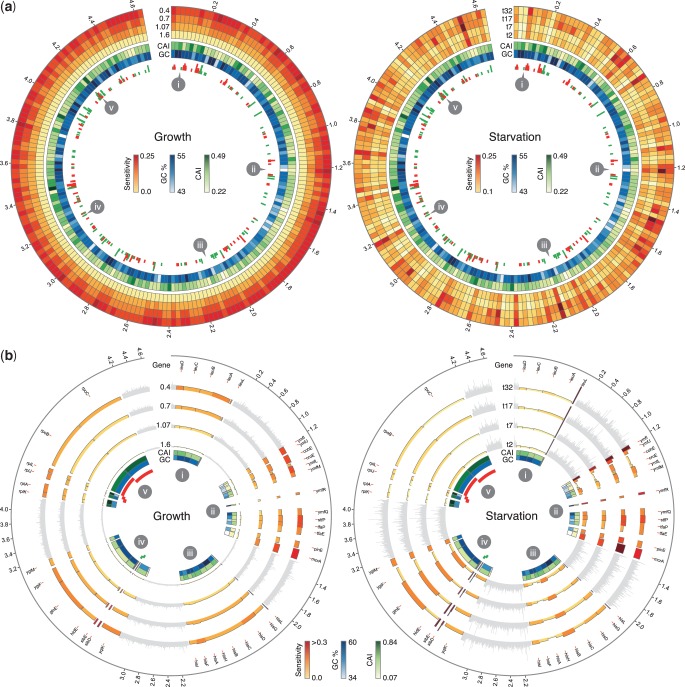
 subunit. The height and color of the histogram tracks relate to the gene sensitivity. Inner most tracks match the upper plots displaying CAI, GC%, essential genes and nucleotide sequences. Highlighted regions are zoomed by a factor of
  to ensure individual genes are visible. Non-highlighted regions are shaded in light gray.
References
-
- Zhang G, Hubalewska M, Ignatova Z. Transient ribosomal attenuation coordinates protein synthesis and co-translational folding. Nat. Struct. Mol. Biol. 2009;16:274–280. - PubMed
Publication types
MeSH terms
Substances
LinkOut - more resources
Full Text Sources
Other Literature Sources
