

CTRP9 transgenic mice are protected from diet-induced obesity and metabolic dysfunction
- PMID: 23842676
- PMCID: PMC3763026
- DOI: 10.1152/ajpregu.00110.2013
CTRP9 transgenic mice are protected from diet-induced obesity and metabolic dysfunction
Abstract
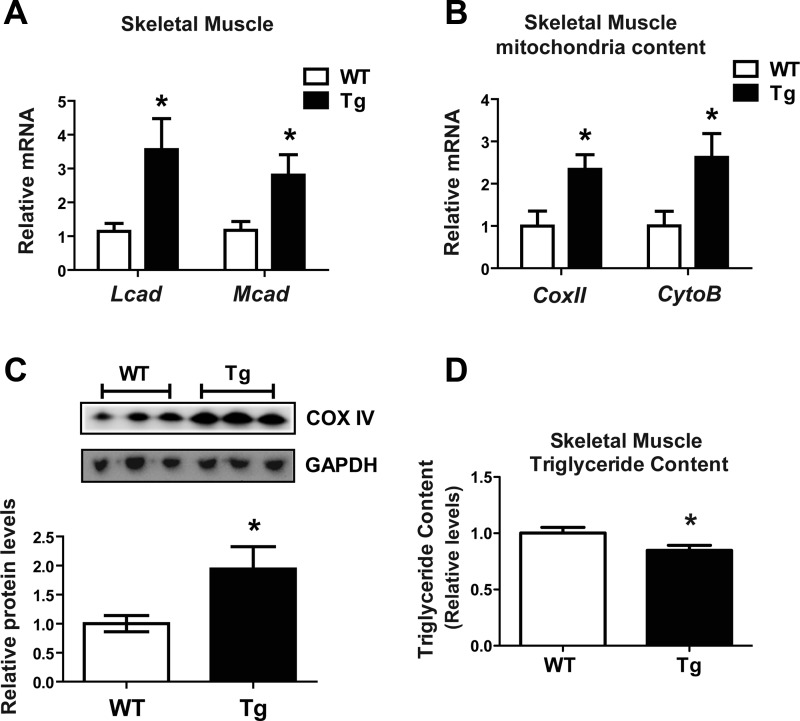
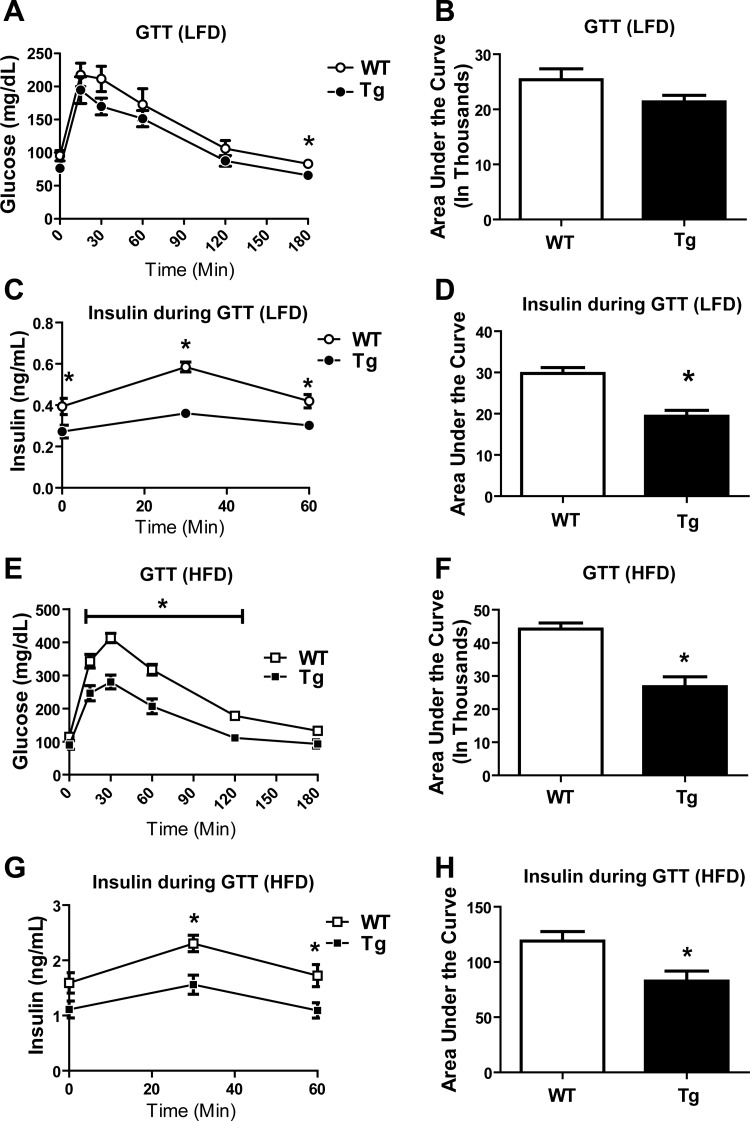
CTRP9 is a secreted multimeric protein of the C1q family and the closest paralog of the insulin-sensitizing adipokine, adiponectin. The metabolic function of this adipose tissue-derived plasma protein remains largely unknown. Here, we show that the circulating levels of CTRP9 are downregulated in diet-induced obese mice and upregulated upon refeeding. Overexpressing CTRP9 resulted in lean mice that dramatically resisted weight gain induced by a high-fat diet, largely through decreased food intake and increased basal metabolism. Enhanced fat oxidation in CTRP9 transgenic mice resulted from increases in skeletal muscle mitochondrial content, expression of enzymes involved in fatty acid oxidation (LCAD and MCAD), and chronic AMPK activation. Hepatic and skeletal muscle triglyceride levels were substantially decreased in transgenic mice. Consequently, CTRP9 transgenic mice had a greatly improved metabolic profile with markedly reduced fasting insulin and glucose levels. The high-fat diet-induced obesity, insulin resistance, and hepatic steatosis observed in wild-type mice were prevented in transgenic mice. Consistent with the in vivo data, recombinant protein significantly enhanced fat oxidation in L6 myotubes via AMPK activation and reduced lipid accumulation in H4IIE hepatocytes. Collectively, these data establish CTRP9 as a novel metabolic regulator and a new component of the metabolic network that links adipose tissue to lipid metabolism in skeletal muscle and liver.
Keywords: AMPK; C1q family; Type 2 diabetes; energy metabolism; fatty acid oxidation; obesity.
Figures


Similar articles
-
Targeted deletion of C1q/TNF-related protein 9 increases food intake, decreases insulin sensitivity, and promotes hepatic steatosis in mice.Am J Physiol Endocrinol Metab. 2014 Apr 1;306(7):E779-90. doi: 10.1152/ajpendo.00593.2013. Epub 2014 Jan 28. Am J Physiol Endocrinol Metab. 2014. PMID: 24473438 Free PMC article.
-
Identification and characterization of CTRP9, a novel secreted glycoprotein, from adipose tissue that reduces serum glucose in mice and forms heterotrimers with adiponectin.FASEB J. 2009 Jan;23(1):241-58. doi: 10.1096/fj.08-114991. Epub 2008 Sep 11. FASEB J. 2009. PMID: 18787108 Free PMC article.
-
C1q/TNF-Related Protein 9 (CTRP9) attenuates hepatic steatosis via the autophagy-mediated inhibition of endoplasmic reticulum stress.Mol Cell Endocrinol. 2015 Dec 5;417:131-40. doi: 10.1016/j.mce.2015.09.027. Epub 2015 Sep 28. Mol Cell Endocrinol. 2015. PMID: 26419929
-
C1q tumor necrosis factor-related protein 9 in atherosclerosis: Mechanistic insights and therapeutic potential.Atherosclerosis. 2018 Sep;276:109-116. doi: 10.1016/j.atherosclerosis.2018.07.022. Epub 2018 Jul 19. Atherosclerosis. 2018. PMID: 30056359 Review.
-
Sirtuin 1 in lipid metabolism and obesity.Ann Med. 2011 May;43(3):198-211. doi: 10.3109/07853890.2010.547211. Epub 2011 Feb 24. Ann Med. 2011. PMID: 21345154 Free PMC article. Review.
Cited by
-
Myocardial mitochondrial and contractile function are preserved in mice lacking adiponectin.PLoS One. 2015 Mar 18;10(3):e0119416. doi: 10.1371/journal.pone.0119416. eCollection 2015. PLoS One. 2015. PMID: 25785965 Free PMC article.
-
Adipocytokines in Cardiovascular and Metabolic Diseases.J Atheroscler Thromb. 2016 Jun 1;23(6):645-54. doi: 10.5551/jat.34918. Epub 2016 Apr 16. J Atheroscler Thromb. 2016. PMID: 27087513 Free PMC article. Review.
-
Astaxanthin Supplemented with High-Intensity Functional Training Decreases Adipokines Levels and Cardiovascular Risk Factors in Men with Obesity.Nutrients. 2023 Jan 6;15(2):286. doi: 10.3390/nu15020286. Nutrients. 2023. PMID: 36678157 Free PMC article. Clinical Trial.
-
Overexpression of CTRP9 attenuates the development of atherosclerosis in apolipoprotein E-deficient mice.Mol Cell Biochem. 2019 May;455(1-2):99-108. doi: 10.1007/s11010-018-3473-y. Epub 2018 Nov 13. Mol Cell Biochem. 2019. PMID: 30426302
-
N-Linked Glycosylation-Dependent and -Independent Mechanisms Regulating CTRP12 Cleavage, Secretion, and Stability.Biochemistry. 2019 Feb 12;58(6):727-741. doi: 10.1021/acs.biochem.8b00528. Epub 2019 Jan 4. Biochemistry. 2019. PMID: 30566828 Free PMC article.
References
-
- Andrikopoulos S, Blair AR, Deluca N, Fam BC, Proietto J. Evaluating the glucose tolerance test in mice. Am J Physiol Endocrinol Metab 295: E1323–E1332, 2008 - PubMed
-
- Bergeron R, Ren JM, Cadman KS, Moore IK, Perret P, Pypaert M, Young LH, Semenkovich CF, Shulman GI. Chronic activation of AMP kinase results in NRF-1 activation and mitochondrial biogenesis. Am J Physiol Endocrinol Metab 281: E1340–E1346, 2001 - PubMed
-
- Bostrom P, Wu J, Jedrychowski MP, Korde A, Ye L, Lo JC, Rasbach KA, Bostrom EA, Choi JH, Long JZ, Kajimura S, Zingaretti MC, Vind BF, Tu H, Cinti S, Hojlund K, Gygi SP, Spiegelman BM. A PGC1-α-dependent myokine that drives brown-fat-like development of white fat and thermogenesis. Nature 481: 463–468, 2012 - PMC - PubMed
-
- Buzzai M, Bauer DE, Jones RG, Deberardinis RJ, Hatzivassiliou G, Elstrom RL, Thompson CB. The glucose dependence of Akt-transformed cells can be reversed by pharmacologic activation of fatty acid beta-oxidation. Oncogene 24: 4165–4173, 2005 - PubMed
Publication types
MeSH terms
Substances
Grants and funding
LinkOut - more resources
Full Text Sources
Other Literature Sources
Medical
Molecular Biology Databases