

Changing views of the biomechanics of vulnerable plaque rupture: a review
- PMID: 23842694
- PMCID: PMC3888649
- DOI: 10.1007/s10439-013-0855-x
Changing views of the biomechanics of vulnerable plaque rupture: a review
Abstract
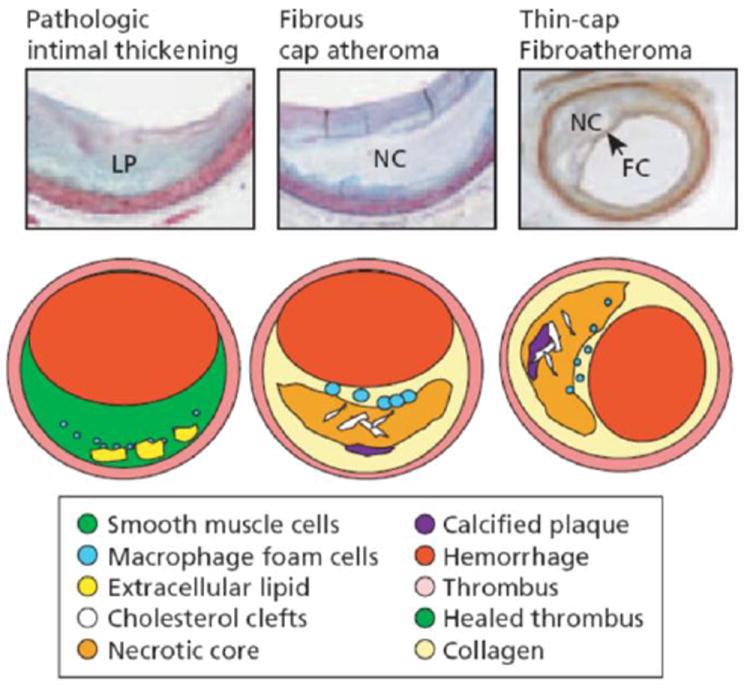
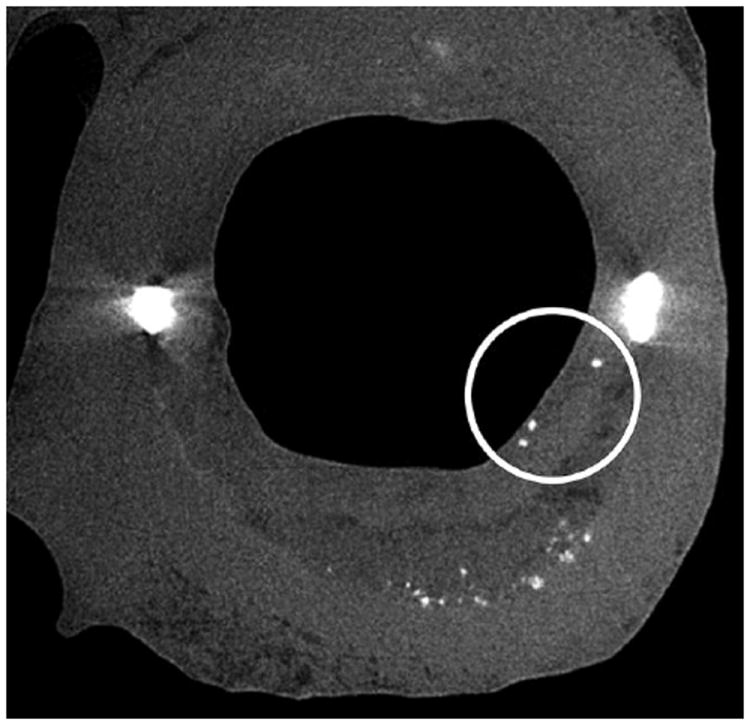
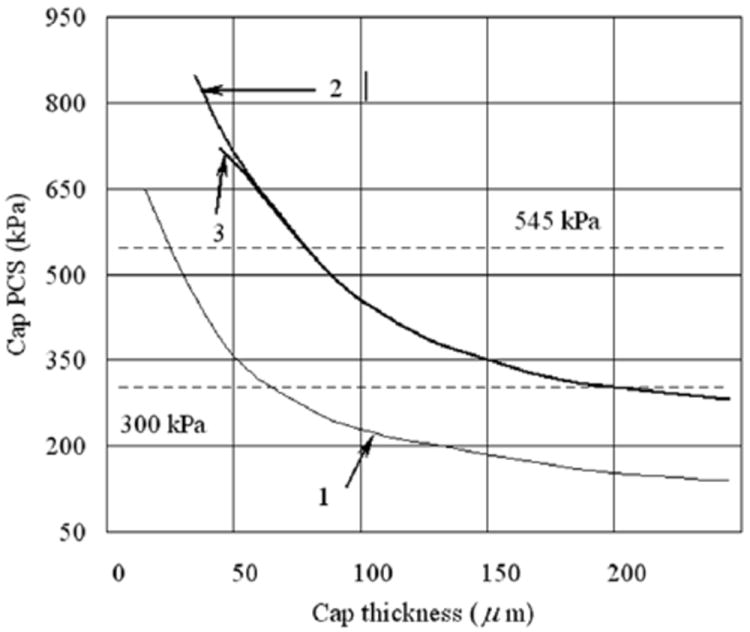
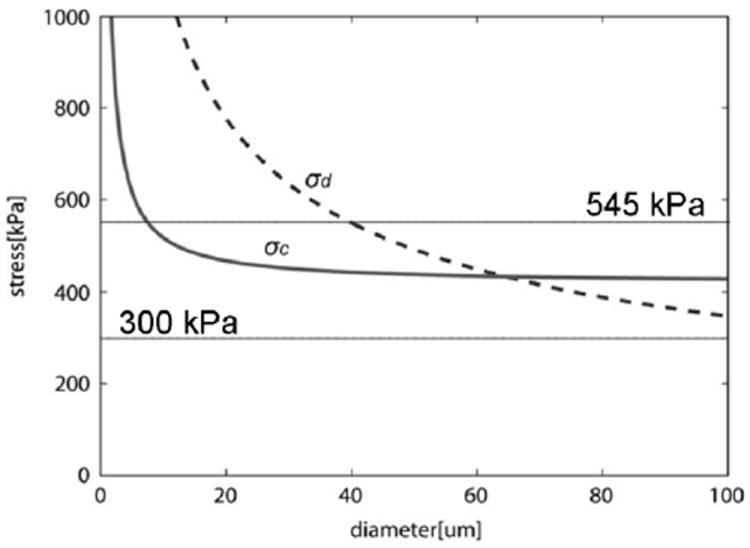
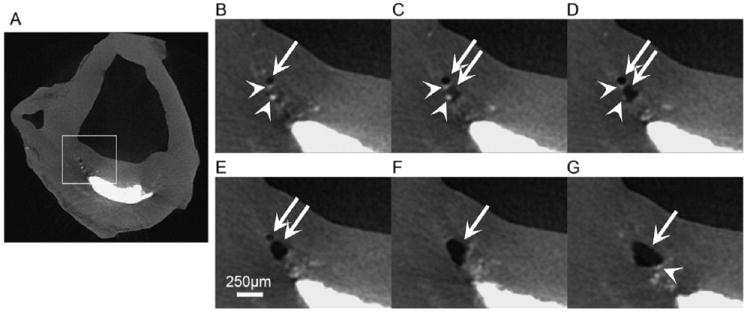
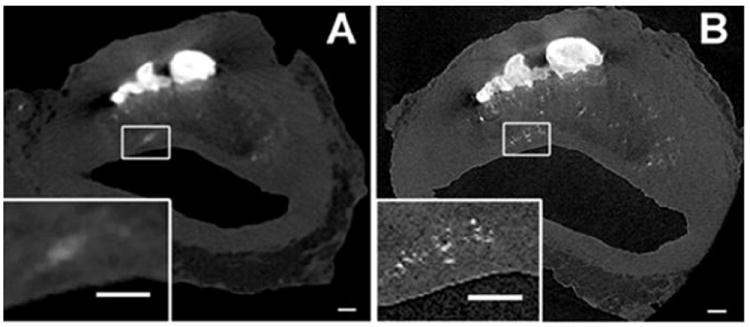
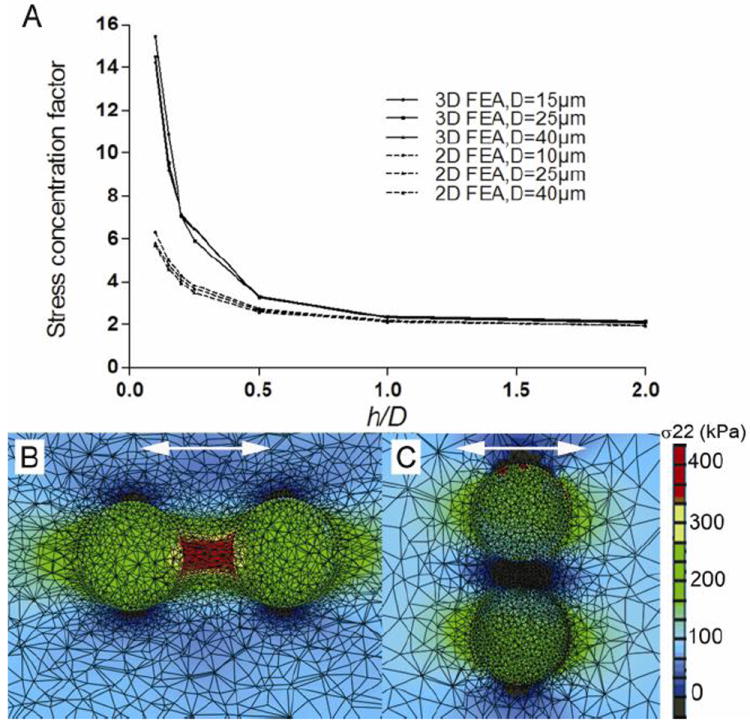
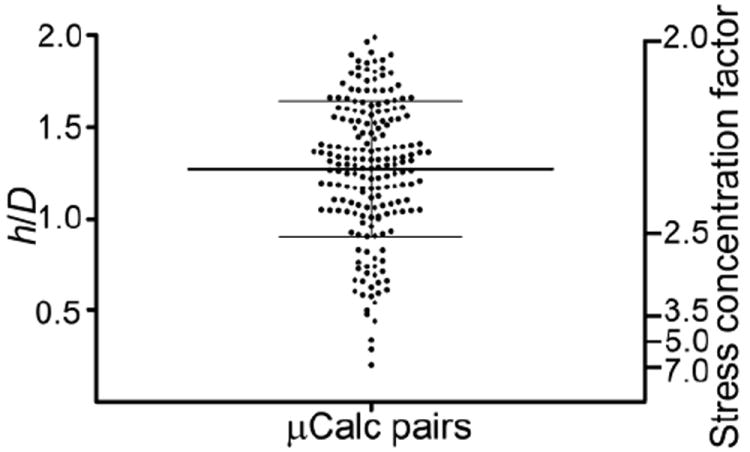
This review examines changing perspectives on the biomechanics of vulnerable plaque rupture over the past 25 years from the first finite element analyses (FEA) showing that the presence of a lipid pool significantly increases the local tissue stress in the atheroma cap to the latest imaging and 3D FEA studies revealing numerous microcalcifications in the cap proper and a new paradigm for cap rupture. The first part of the review summarizes studies describing the role of the fibrous cap thickness, tissue properties, and lesion geometry as main determinants of the risk of rupture. Advantages and limitations of current imaging technologies for assessment of vulnerable plaques are also discussed. However, the basic paradoxes as to why ruptures frequently did not coincide with location of PCS and why caps >65 μm thickness could rupture at tissue stresses significantly below the 300 kPa critical threshold still remained unresolved. The second part of the review describes recent studies in the role of microcalcifications, their origin, shape, and clustering in explaining these unresolved issues including the actual mechanism of rupture due to the explosive growth of tiny voids (cavitation) in local regions of high stress concentration between closely spaced microinclusions oriented along their tensile axis.
Conflict of interest statement
The authors have no conflict of interest.
Figures
Similar articles
-
The explosive growth of small voids in vulnerable cap rupture; cavitation and interfacial debonding.J Biomech. 2013 Jan 18;46(2):396-401. doi: 10.1016/j.jbiomech.2012.10.040. Epub 2012 Dec 6. J Biomech. 2013. PMID: 23218838 Free PMC article.
-
Effect of tissue properties, shape and orientation of microcalcifications on vulnerable cap stability using different hyperelastic constitutive models.J Biomech. 2014 Mar 3;47(4):870-7. doi: 10.1016/j.jbiomech.2014.01.010. Epub 2014 Jan 13. J Biomech. 2014. PMID: 24503048 Free PMC article.
-
A mechanistic analysis of the role of microcalcifications in atherosclerotic plaque stability: potential implications for plaque rupture.Am J Physiol Heart Circ Physiol. 2012 Sep 1;303(5):H619-28. doi: 10.1152/ajpheart.00036.2012. Epub 2012 Jul 9. Am J Physiol Heart Circ Physiol. 2012. PMID: 22777419 Free PMC article.
-
Microcalcifications, Their Genesis, Growth, and Biomechanical Stability in Fibrous Cap Rupture.Adv Exp Med Biol. 2018;1097:129-155. doi: 10.1007/978-3-319-96445-4_7. Adv Exp Med Biol. 2018. PMID: 30315543 Review.
-
Computational approaches for analyzing the mechanics of atherosclerotic plaques: a review.J Biomech. 2014 Mar 3;47(4):859-69. doi: 10.1016/j.jbiomech.2014.01.011. Epub 2014 Jan 21. J Biomech. 2014. PMID: 24491496 Review.
Cited by
-
Multi-patient study for coronary vulnerable plaque model comparisons: 2D/3D and fluid-structure interaction simulations.Biomech Model Mechanobiol. 2021 Aug;20(4):1383-1397. doi: 10.1007/s10237-021-01450-8. Epub 2021 Mar 23. Biomech Model Mechanobiol. 2021. PMID: 33759037 Free PMC article.
-
Non-invasive in vivo characterization of human carotid plaques with acoustic radiation force impulse ultrasound: comparison with histology after endarterectomy.Ultrasound Med Biol. 2015 Mar;41(3):685-97. doi: 10.1016/j.ultrasmedbio.2014.09.016. Epub 2015 Jan 22. Ultrasound Med Biol. 2015. PMID: 25619778 Free PMC article.
-
Coronary Artery Microcalcification: Imaging and Clinical Implications.Diagnostics (Basel). 2019 Sep 23;9(4):125. doi: 10.3390/diagnostics9040125. Diagnostics (Basel). 2019. PMID: 31547506 Free PMC article. Review.
-
Impact of residual stress on coronary plaque stress/strain calculations using optical coherence tomography image-based multi-layer models.Front Cardiovasc Med. 2024 Apr 25;11:1395257. doi: 10.3389/fcvm.2024.1395257. eCollection 2024. Front Cardiovasc Med. 2024. PMID: 38725836 Free PMC article.
-
Robust quantitative assessment of collagen fibers with picrosirius red stain and linearly polarized light as demonstrated on atherosclerotic plaque samples.PLoS One. 2021 Mar 18;16(3):e0248068. doi: 10.1371/journal.pone.0248068. eCollection 2021. PLoS One. 2021. PMID: 33735190 Free PMC article.
References
-
- Aikawa E, et al. Osteogenesis associates with inflammation in early-stage atherosclerosis evaluated by molecular imaging in vivo. Circulation. 2007;116(24):2841–2850. - PubMed
-
- Barrett SR, Sutcliffe MP, Howarth S, Li ZY, Gillard JH. Experimental measurement of the mechanical properties of carotid atherothrombotic plaque fibrous cap. J Biomech. 2009;42(11):1650–1655. - PubMed
-
- Berliner JA, et al. Atherosclerosis: basic mechanisms. Oxidation, inflammation, and genetics Circulation. 1995;91(9):2488–2496. - PubMed
Publication types
MeSH terms
Grants and funding
LinkOut - more resources
Full Text Sources
Other Literature Sources
Miscellaneous
