

Flow perfusion co-culture of human mesenchymal stem cells and endothelial cells on biodegradable polymer scaffolds
- PMID: 23842695
- PMCID: PMC3849322
- DOI: 10.1007/s10439-013-0862-y
Flow perfusion co-culture of human mesenchymal stem cells and endothelial cells on biodegradable polymer scaffolds
Abstract
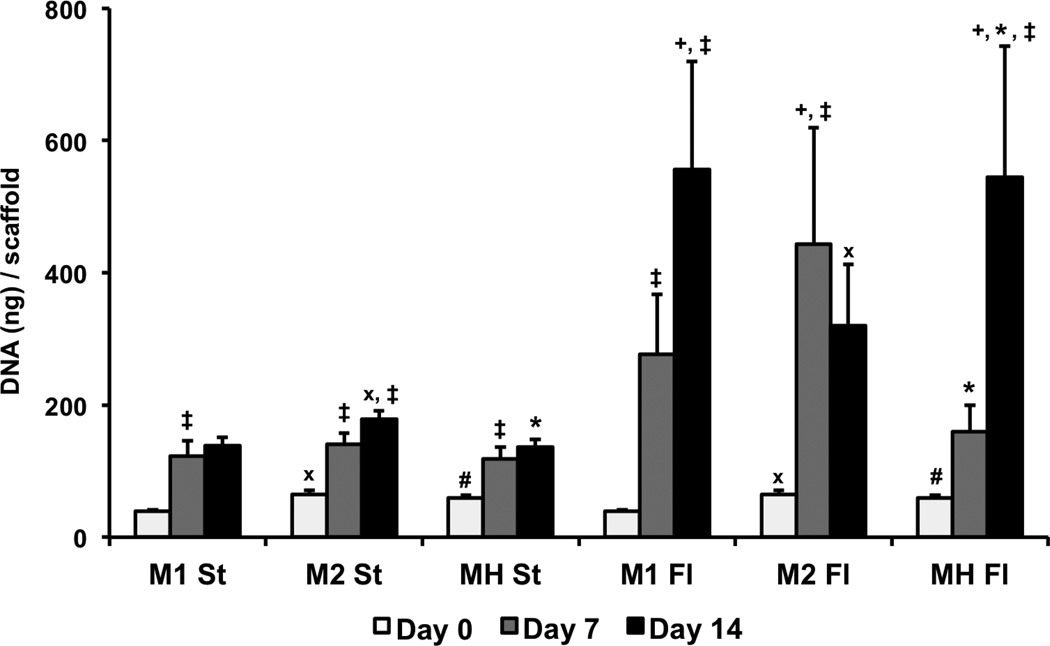
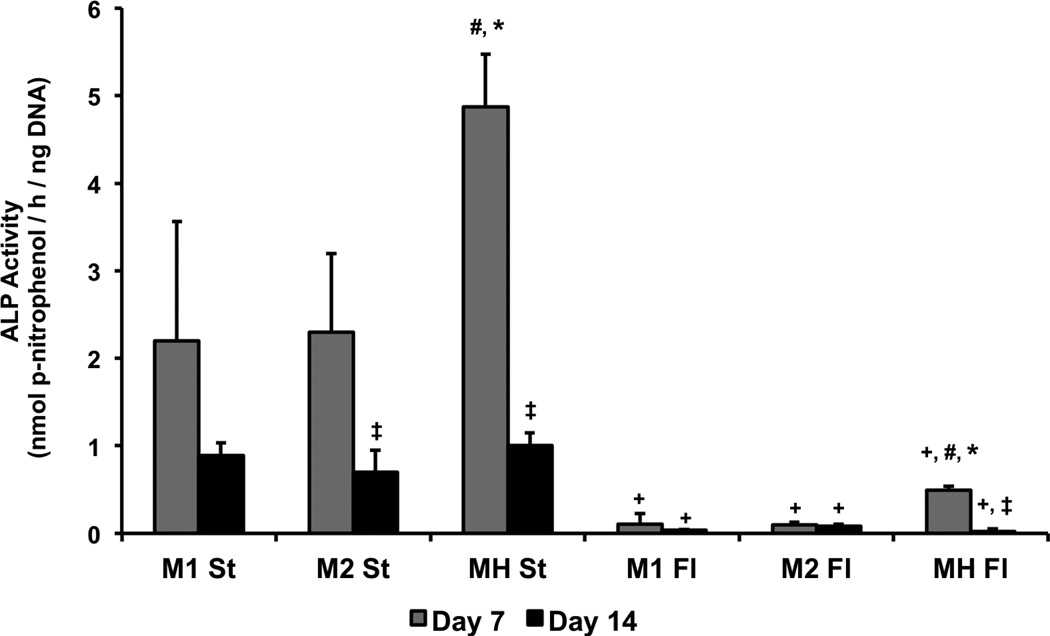
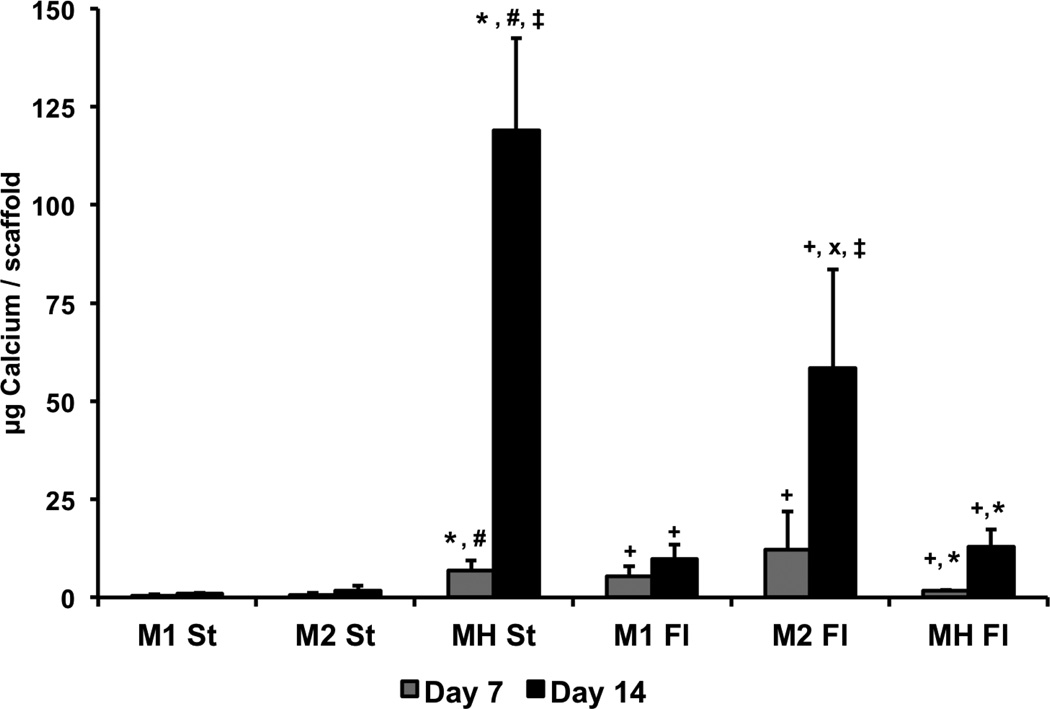
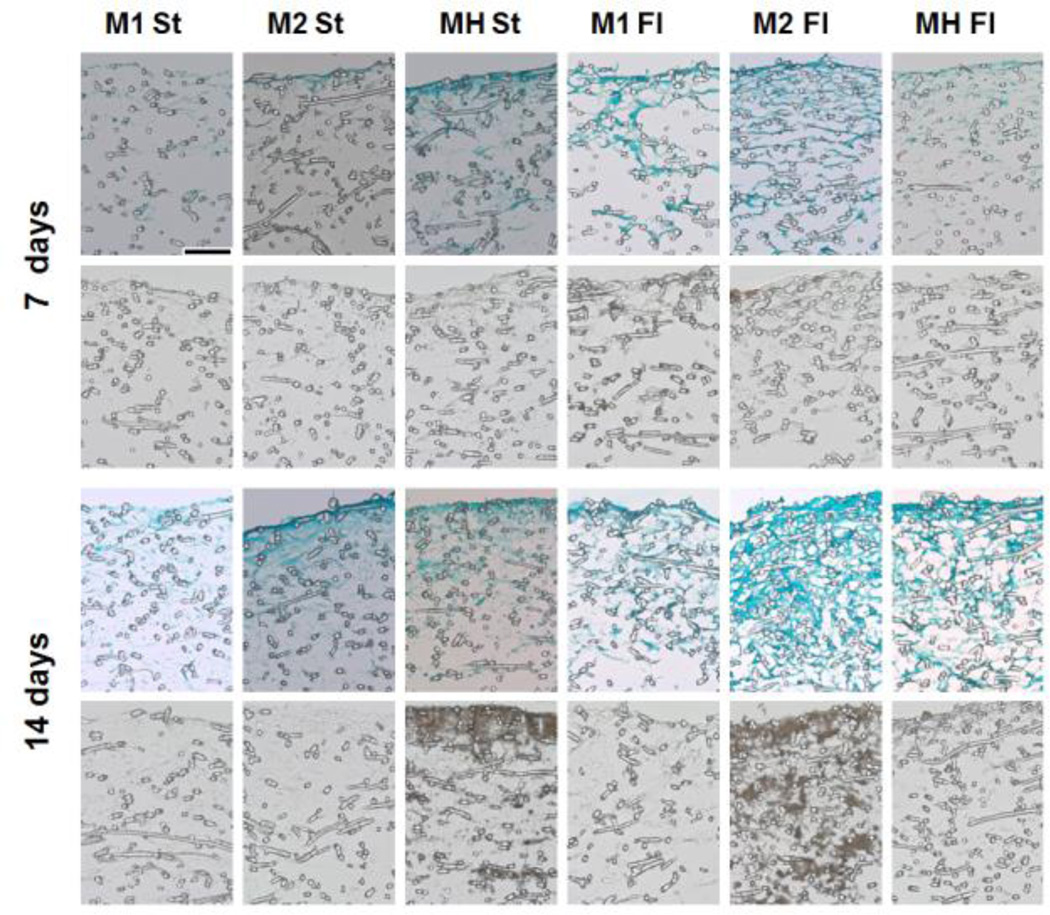
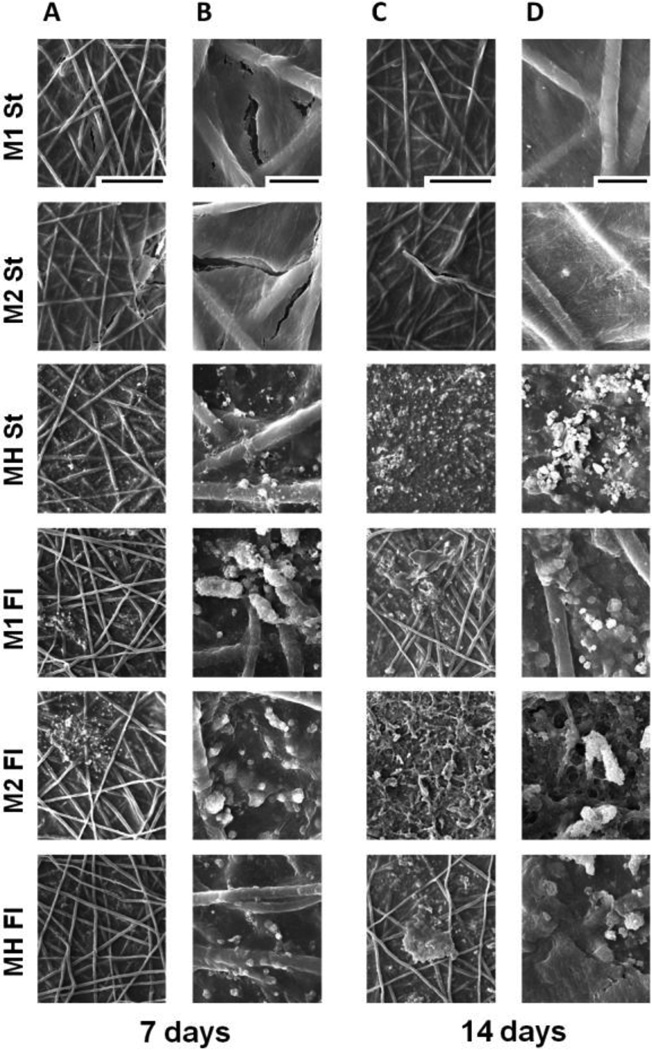
In this study, we investigated the effect of flow perfusion culture on the mineralization of co-cultures of human umbilical vein endothelial cells (HUVECs) and human mesenchymal stem cells (hMSCs). Osteogenically precultured hMSCs were seeded onto electrospun scaffolds in monoculture or a 1:1 ratio with HUVECs, cultured for 7 or 14 days in osteogenic medium under static or flow perfusion conditions, and the resulting constructs were analyzed for cellularity, alkaline phosphatase (ALP) activity and calcium content. In flow perfusion, constructs with monocultures of hMSCs demonstrated higher cellularity and calcium content, but lower ALP activity compared to corresponding static controls. ALP activity was enhanced in co-cultures under flow perfusion conditions, compared to hMSCs alone; however unlike the static controls, the calcium content of the co-cultures in flow perfusion was not different from the corresponding hMSC monocultures. The data suggest that co-cultures of hMSCs and HUVECs did not contribute to enhanced mineralization compared to hMSCs alone under the flow perfusion conditions investigated in this study. However, flow perfusion culture resulted in an enhanced spatial distribution of cells and matrix compared to static cultures, which were limited to a thin surface layer.
Figures
Similar articles
-
Enhanced osteogenesis in cocultures with human mesenchymal stem cells and endothelial cells on polymeric microfiber scaffolds.Tissue Eng Part A. 2013 Dec;19(23-24):2565-76. doi: 10.1089/ten.TEA.2013.0256. Epub 2013 Aug 2. Tissue Eng Part A. 2013. PMID: 23799306 Free PMC article.
-
Effects of Fiber Alignment and Coculture with Endothelial Cells on Osteogenic Differentiation of Mesenchymal Stromal Cells.Tissue Eng Part C Methods. 2020 Jan;26(1):11-22. doi: 10.1089/ten.TEC.2019.0232. Epub 2019 Dec 27. Tissue Eng Part C Methods. 2020. PMID: 31774033
-
Influence of scaffold properties on the inter-relationship between human bone marrow derived stromal cells and endothelial cells in pro-osteogenic conditions.Acta Biomater. 2015 Oct;25:16-23. doi: 10.1016/j.actbio.2015.07.013. Epub 2015 Jul 7. Acta Biomater. 2015. PMID: 26162586
-
Endothelial cells support osteogenesis in an in vitro vascularized bone model developed by 3D bioprinting.Biofabrication. 2020 Feb 19;12(2):025013. doi: 10.1088/1758-5090/ab6a1d. Biofabrication. 2020. PMID: 31929117
-
Osteogenic and Angiogenic Synergy of Human Adipose Stem Cells and Human Umbilical Vein Endothelial Cells Cocultured in a Modified Perfusion Bioreactor.Organogenesis. 2021 Oct 2;17(3-4):56-71. doi: 10.1080/15476278.2021.1954769. Epub 2021 Jul 29. Organogenesis. 2021. PMID: 34323661 Free PMC article.
Cited by
-
Influence of biomechanical and biochemical stimulation on the proliferation and differentiation of bone marrow stromal cells seeded on polyurethane scaffolds.Exp Ther Med. 2016 Jun;11(6):2086-2094. doi: 10.3892/etm.2016.3206. Epub 2016 Mar 30. Exp Ther Med. 2016. PMID: 27284290 Free PMC article.
-
Bone Spheroid Development Under Flow Conditions with Mesenchymal Stem Cells and Human Umbilical Vein Endothelial Cells in a 3D Porous Hydrogel Supplemented with Hydroxyapatite.Gels. 2024 Oct 18;10(10):666. doi: 10.3390/gels10100666. Gels. 2024. PMID: 39451319 Free PMC article.
-
Collagen hydrogel scaffold promotes mesenchymal stem cell and endothelial cell coculture for bone tissue engineering.J Biomed Mater Res A. 2017 Apr;105(4):1123-1131. doi: 10.1002/jbm.a.36008. Epub 2017 Feb 2. J Biomed Mater Res A. 2017. PMID: 28093887 Free PMC article.
-
Fluid shear stress and endothelial cells synergistically promote osteogenesis of mesenchymal stem cells via integrin β1-FAK-ERK1/2 pathway.Turk J Biol. 2021 Dec 14;45(6):683-694. doi: 10.3906/biy-2104-20. eCollection 2021. Turk J Biol. 2021. PMID: 35068949 Free PMC article.
-
Research progress on the regulatory mechanism of integrin-mediated mechanical stress in cells involved in bone metabolism.J Cell Mol Med. 2024 Apr;28(7):e18183. doi: 10.1111/jcmm.18183. J Cell Mol Med. 2024. PMID: 38506078 Free PMC article. Review.
References
-
- Bjerre L, Bunger CE, Kassem M, Mygind T. Flow perfusion culture of human mesenchymal stem cells on silicate-substituted tricalcium phosphate scaffolds. Biomaterials. 2008;29(17):2616–2627. - PubMed
-
- Bulnheim U, Muller P, Neumann HG, Peters K, Unger RE, Kirkpatrick CJ, Rychly J. Endothelial cells stimulate osteogenic differentiation of mesenchymal stem cells on calcium phosphate scaffolds. J Tissue Eng Regen Med. 2012 - PubMed
-
- Cartmell SH, Porter BD, Garcia AJ, Guldberg RE. Effects of medium perfusion rate on cell-seeded three-dimensional bone constructs in vitro. Tissue Eng. 2003;9(6):1197–1203. - PubMed
-
- Dahlin RL, Meretoja VV, Ni M, Kasper FK, Mikos AG. Hypoxia and flow perfusion modulate proliferation and gene expression of articular chondrocytes on porous scaffolds. AIChE Journal. 2012
Publication types
MeSH terms
Substances
Grants and funding
LinkOut - more resources
Full Text Sources
Other Literature Sources
