Early detection of high-grade squamous intraepithelial lesions in the cervix with quantitative spectroscopic imaging
- PMID: 23843090
- PMCID: PMC3706901
- DOI: 10.1117/1.JBO.18.7.076013
Early detection of high-grade squamous intraepithelial lesions in the cervix with quantitative spectroscopic imaging
Abstract
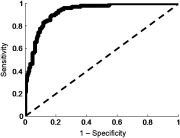
Quantitative spectroscopy has recently been extended from a contact-probe to wide-area spectroscopic imaging to enable mapping of optical properties across a wide area of tissue. We train quantitative spectroscopic imaging (QSI) to identify cervical high-grade squamous intraepithelial lesions (HSILs) in 34 subjects undergoing the loop electrosurgical excision procedure (LEEP subjects). QSI's performance is then prospectively evaluated on the clinically suspicious biopsy sites from 47 subjects undergoing colposcopic-directed biopsy. The results show the per-subject normalized reduced scattering coefficient at 700 nm (An) and the total hemoglobin concentration are significantly different (p<0.05) between HSIL and non-HSIL sites in LEEP subjects. An alone retrospectively distinguishes HSIL from non-HSIL with 89% sensitivity and 83% specificity. It alone applied prospectively on the biopsy sites distinguishes HSIL from non-HSIL with 81% sensitivity and 78% specificity. The findings of this study agree with those of an earlier contact-probe study, validating the robustness of QSI, and specifically An, for identifying HSIL. The performance of An suggests an easy to use and an inexpensive to manufacture monochromatic instrument is capable of early cervical cancer detection, which could be used as a screening and diagnostic tool for detecting cervical cancer in low resource countries.
Figures


Similar articles
-
Pathologic discrepancies between colposcopy-directed biopsy and loop electrosurgical excision procedure of the uterine cervix in women with cytologic high-grade squamous intraepithelial lesions.J Gynecol Oncol. 2020 Mar;31(2):e13. doi: 10.3802/jgo.2020.31.e13. Epub 2019 Aug 22. J Gynecol Oncol. 2020. PMID: 31912671 Free PMC article.
-
A retrospective analysis on 1901 women with high grade cervical intraepithelial neoplasia by colposcopic biopsy.Eur J Obstet Gynecol Reprod Biol. 2017 Oct;217:53-58. doi: 10.1016/j.ejogrb.2017.07.005. Epub 2017 Jul 5. Eur J Obstet Gynecol Reprod Biol. 2017. PMID: 28850822
-
Thin HSIL of the Cervix: Detecting a Variant of High-grade Squamous Intraepithelial Lesions With a p16INK4a Antibody.Int J Gynecol Pathol. 2017 Jan;36(1):71-75. doi: 10.1097/PGP.0000000000000311. Int J Gynecol Pathol. 2017. PMID: 27513079
-
Colposcopy, cervicography, speculoscopy and endoscopy. International Academy of Cytology Task Force summary. Diagnostic Cytology Towards the 21st Century: An International Expert Conference and Tutorial.Acta Cytol. 1998 Jan-Feb;42(1):33-49. doi: 10.1159/000331533. Acta Cytol. 1998. PMID: 9479322 Review.
-
Clinical importance of "low-grade squamous intraepithelial lesion, cannot exclude high-grade squamous intraepithelial lesion (LSIL-H)" terminology for cervical smears 5-year analysis of the positive predictive value of LSIL-H compared with ASC-H, LSIL, and HSIL in the detection of high-grade cervical lesions with a review of the literature.Gynecol Oncol. 2011 Apr;121(1):152-6. doi: 10.1016/j.ygyno.2010.12.004. Epub 2011 Jan 5. Gynecol Oncol. 2011. PMID: 21211831 Review.
References
-
- Saslow D., et al. , “American Cancer Society, American Society for Colposcopy and Cervical Pathology, and American Society for Clinical Pathology screening guidelines for the prevention and early detection of cervical cancer,” CA Cancer J. Clin. 62(3), 147–172 (2012).CAMCAM10.3322/caac.v62:3 - DOI - PMC - PubMed

