. 2013 Sep 7;280(1766):20130697.
doi: 10.1098/rspb.2013.0697. Print 2013 Sep 7.

The length-tension curve in muscle depends on lattice spacing

Affiliations

The length-tension curve in muscle depends on lattice spacing

C David Williams et al. Proc Biol Sci. .

Abstract

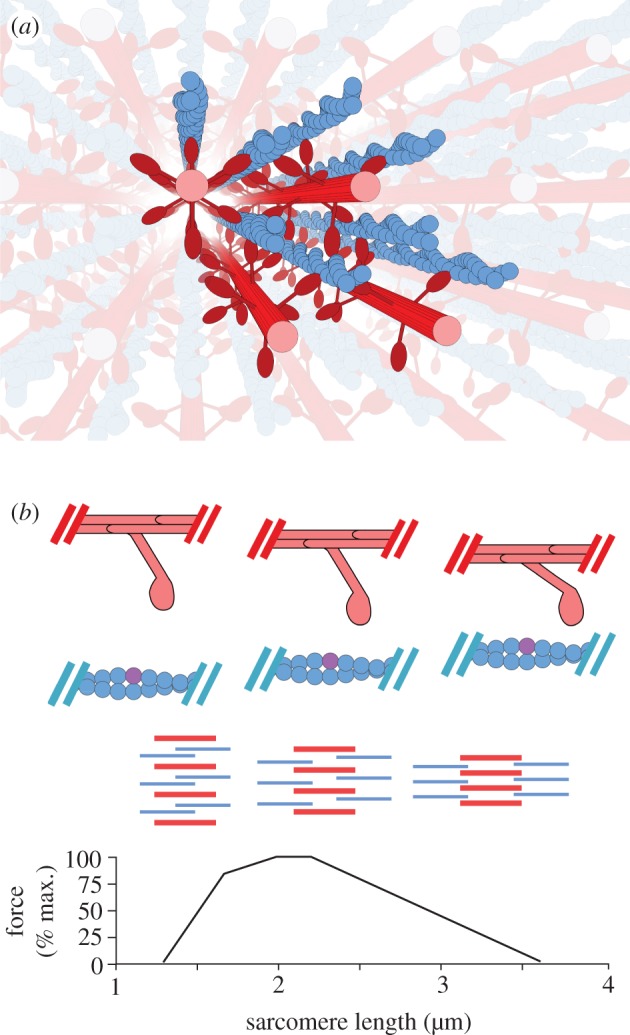
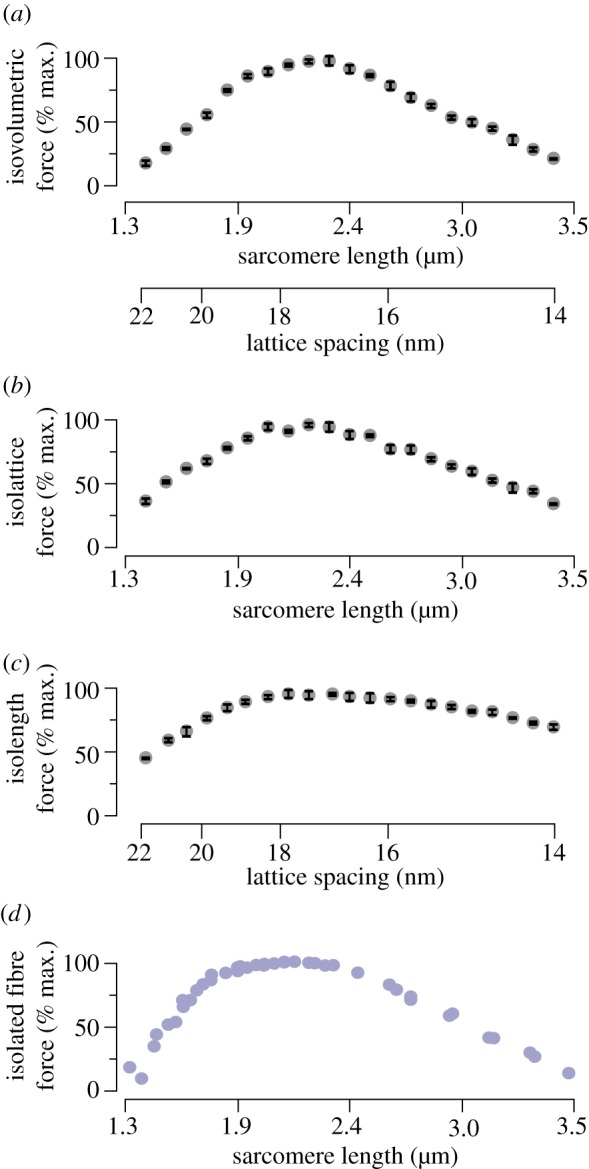
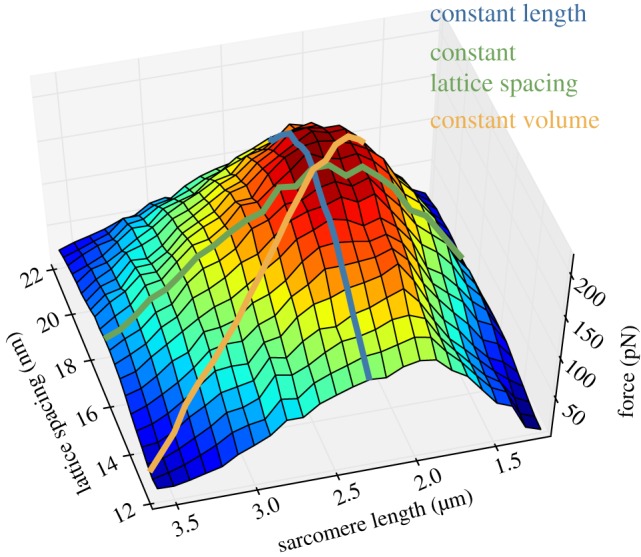
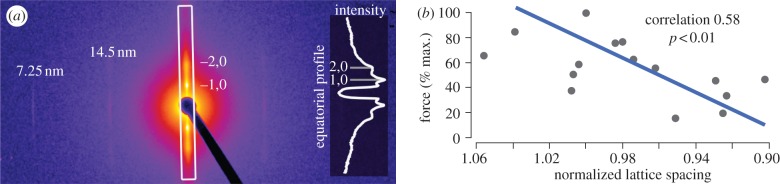
Classic interpretations of the striated muscle length-tension curve focus on how force varies with overlap of thin (actin) and thick (myosin) filaments. New models of sarcomere geometry and experiments with skinned synchronous insect flight muscle suggest that changes in the radial distance between the actin and myosin filaments, the filament lattice spacing, are responsible for between 20% and 50% of the change in force seen between sarcomere lengths of 1.4 and 3.4 µm. Thus, lattice spacing is a significant force regulator, increasing the slope of muscle's force-length dependence.

Keywords: X-ray diffraction; lattice spacing; length–tension curve; muscle contraction; spatially explicit.


Figures

Figure 1.
Figure 1.
(a) A spatially explicit three-dimensional multifilament model of the sarcomere generates varying levels of force as lattice spacing varies across the length–tension (LT) curve. The multifilament model of the half-sarcomere uses eight thin filaments and four thick filaments, populated by two-dimensional cross-bridge models. Simulated filaments are depicted in bold colours, and mirrored versions of those filaments which are reached by passing through a boundary are shown in light colours. Toroidal boundary conditions simulate an infinite lattice of contractile filaments, which is sensitive to changes in radial spacing. (b) Filament overlap and lattice spacing changes across the LT curve. From bottom to top, the LT curve for vertebrate skeletal muscle, a diagram of the relative degree of overlap and lattice spacing in the sarcomere across the LT curve, and a cartoon depicting the relative locations of a single cross-bridge and the thin filament across the LT curve. In the filament schematic, the thick filaments are shown in red while the thin filaments are shown in blue. The thick filaments are radially compressed from left to right, as overlap with the thin filaments decreases and sarcomere length increases. In the single cross-bridge cartoon, the lattice spacing decreases as sarcomere length grows from left to right. An example binding site is shown in purple, demonstrating in the rightmost column the geometric restriction that accompanies highly compressed lattice spacings. (Online version in colour.)
Figure 2.
Figure 2.
Isovolumetric, isolattice and isolength force curves compared with isolated fibre measurements. (a) The force generated along a simulated isovolumetric LT curve shows the classic three-region shape. To maintain a constant lattice volume, lattice spacing changes as the square root of (1 divided by sarcomere length). Force at extreme sarcomere lengths/lattice spacings is decreased by over 75% from its peak value. Error bars depict the standard deviation of the maximal force across all trials. (b) The simulated LT curve where only sarcomere length varies, and lattice spacing is held at 17.1 nm (corresponding to a d10 lattice spacing of 36 nm), recreates more of the isovolumetric case's slope. Force decreases by over 50% at either extreme. (c) The simulated LT curve where only lattice spacing changes, and sarcomere length is fixed at 2.4 µm, shows a reduced slope. However, force decreases by more than 50% from its peak at larger lattice spacings (corresponding to short sarcomere lengths) and decreases by more than 25% at smaller lattice spacings (corresponding to long sarcomere lengths). (d) For comparison with the above, the maximum force developed by isolated frog striated muscle is presented, modified from Gordon et al. [4]. All sarcomere lengths and lattice spacings are chosen to reflect the range over which vertebrate striated muscle varies in isometric contractions along the length–tension (LT) curve [3]. (Online version in colour.)
Figure 3.
Figure 3.
Force at all lattice spacings and sarcomere lengths. Both lattice spacing and sarcomere length tune force, as shown by the dependence of force on lattice spacing at all sarcomere lengths and on sarcomere length at all lattice spacings. An isovolumetric path through the parameters of lattice spacing and sarcomere length results in an LT curve of nearly maximal steepness. Peak force is seen at 17.5 nm lattice spacing and 2.3 µm sarcomere length. (Online version in colour.)
Figure 4.
Figure 4.
Normalized force of skinned fibres under osmotic compression. The force generated by skinned osmotically compressed fibres was measured using small-angle X-ray fibre diffraction, a sample image of which is shown. (a) Diffraction image of skinned Manduca sexta flight muscle bundle with largely vertical equatorial axis. The dark line and dark central circle are due to a backstop protecting the detector from direct exposure to the X-ray beam. The 1,0 and 2,0 equatorial diffraction peaks, along with the 14.5 nm and 7.25 nm meridional reflections, are labelled. The boxed intensity profile along the equator is inset. Lattice spacings were estimated from the separation of the 1,0 equatorial diffraction peaks as described by Irving [16]. (b) Maximum force produced through Ca2+ activation of fibres stretched to the descending limb decreases as lattice spacing is shrunk through osmotic compression. Lattice spacing is displayed as normalized to the lattice spacing on the initial post-skinning activation to control for variability between fibres. Lattice spacing is shown as decreasing from left to right to facilitate comparison with the descending limb of the LT curve as conventionally depicted in figure 2. (Online version in colour.)

References

    1. Cobb M. 2002. Timeline: exorcizing the animal spirits: Jan Swammerdam on nerve function. Nat. Rev. Neurosci. 3, 395–400 (doi:10.1038/nrn806) - DOI - PubMed
    1. Irving TC, Konhilas JP, Perry D, Fischetti R, de Tombe PP. 2000. Myofilament lattice spacing as a function of sarcomere length in isolated rat myocardium. Am. J. Physiol. Heart Circ. Physiol. 279, H2568–H2573 - PubMed
    1. Millman BM. 1998. The filament lattice of striated muscle. Physiol. Rev. 78, 359–391 - PubMed
    1. Gordon AM, Huxley AF, Julian FJ. 1966. The variation in isometric tension with sarcomere length in vertebrate muscle fibres. J. Physiol. 184, 170–192 - PMC - PubMed
    1. Rassier DE, MacIntosh BR, Herzog W. 1999. Length dependence of active force production in skeletal muscle. J. Appl. Physiol. 86, 1445–1457 - PubMed

Publication types

LinkOut - more resources