. 2013 Oct;110(7):1631-45.
doi: 10.1152/jn.00232.2013. Epub 2013 Jul 10.

Dynamic modulation of spike timing-dependent calcium influx during corticostriatal upstates

Affiliations

Dynamic modulation of spike timing-dependent calcium influx during corticostriatal upstates

R C Evans et al. J Neurophysiol. 2013 Oct.

Abstract

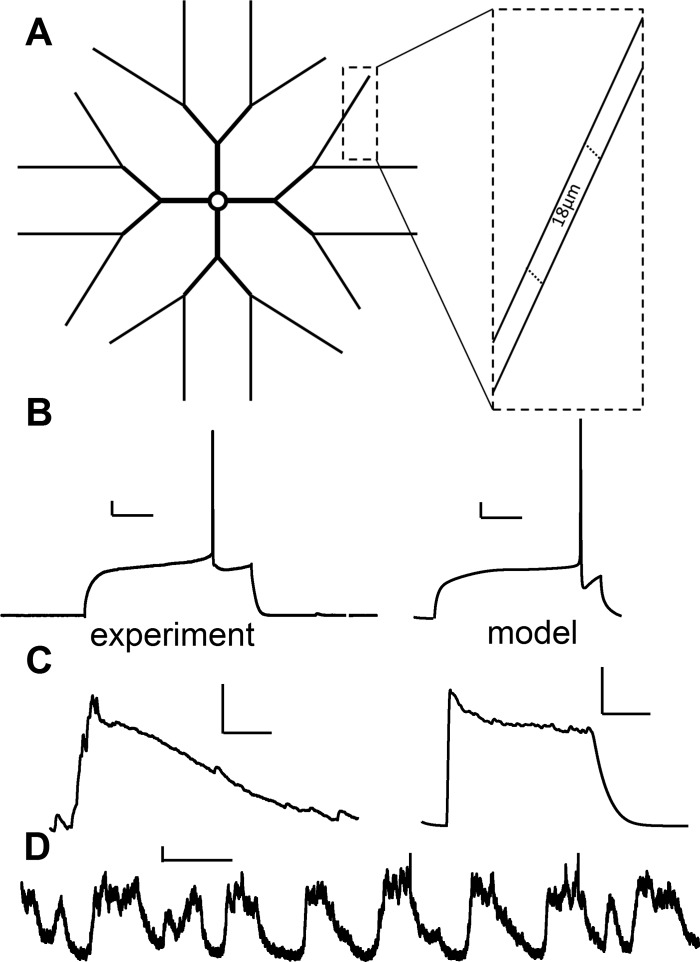
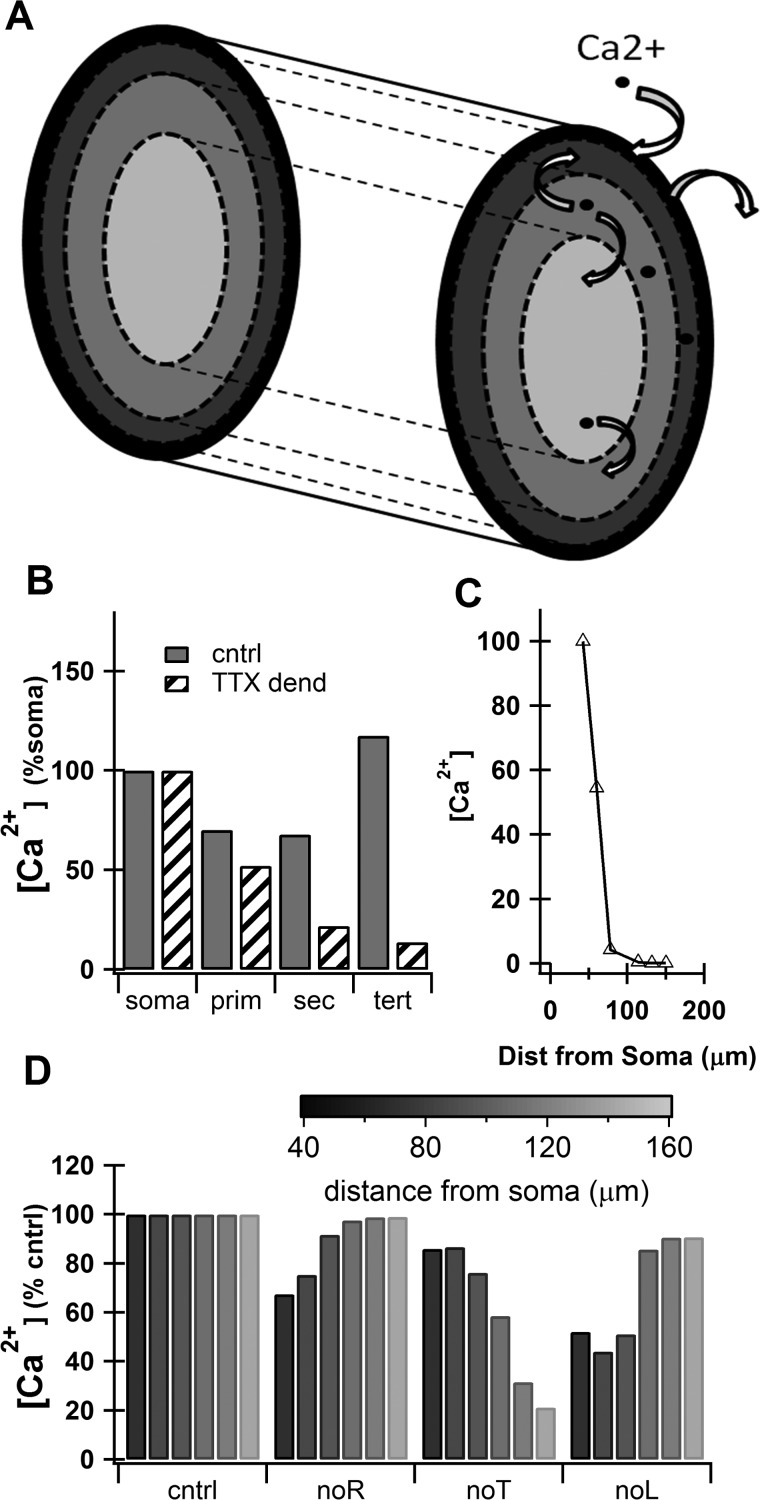
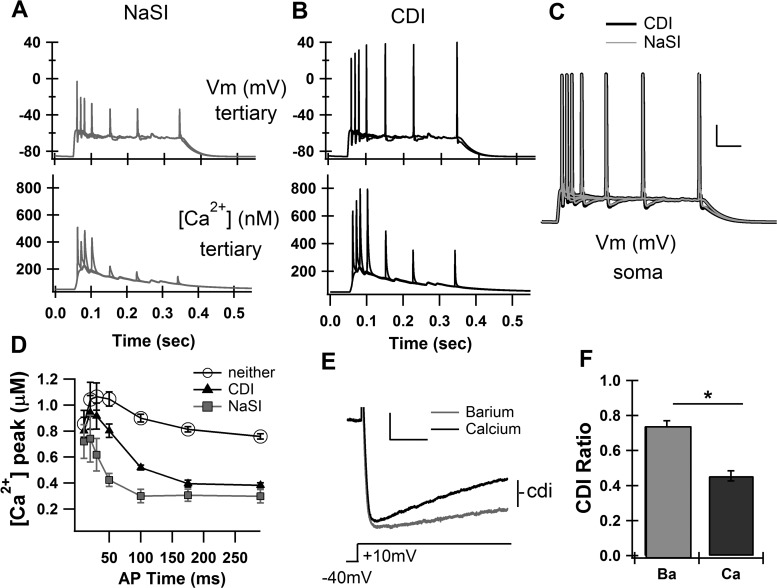
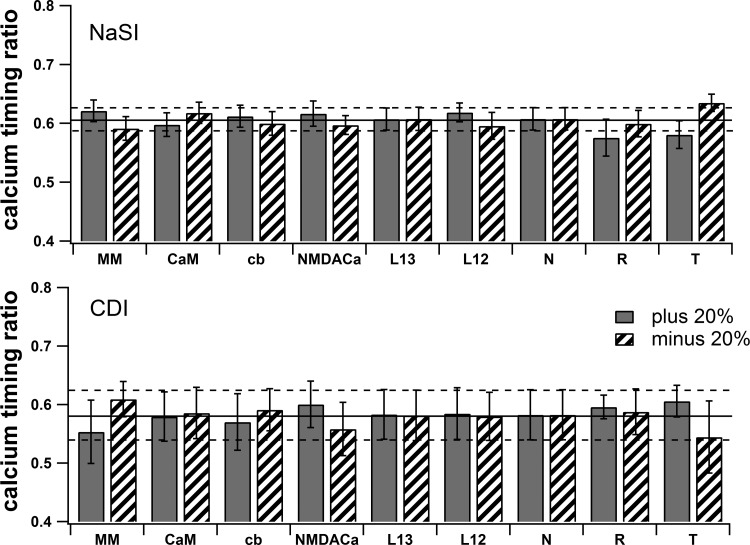
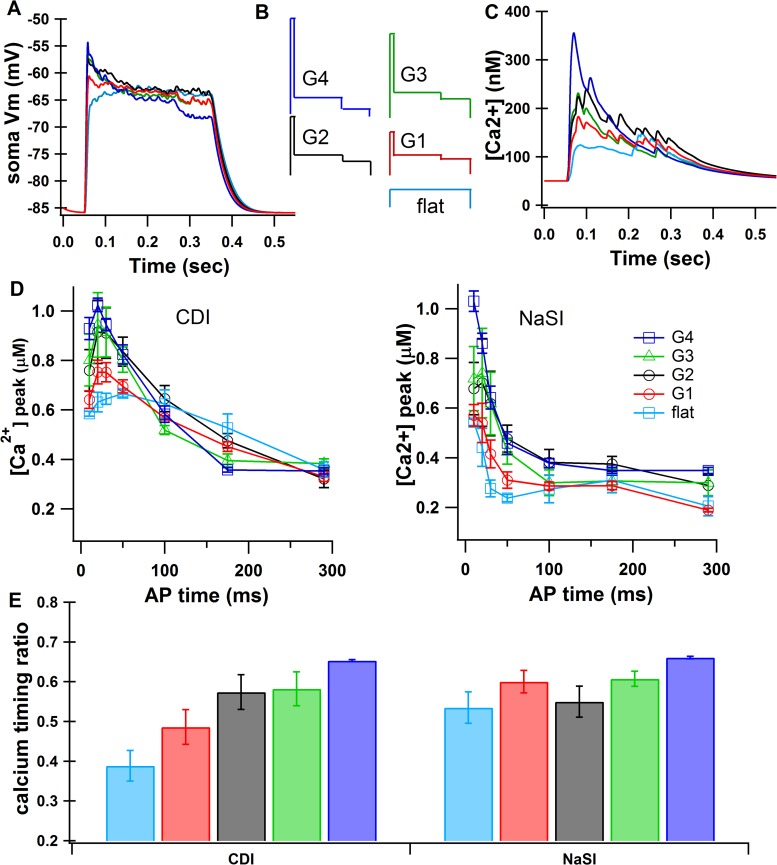
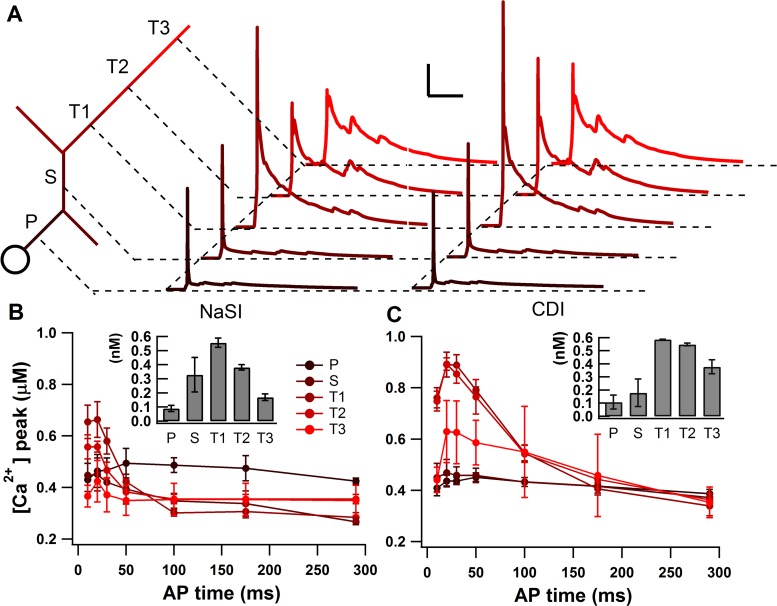
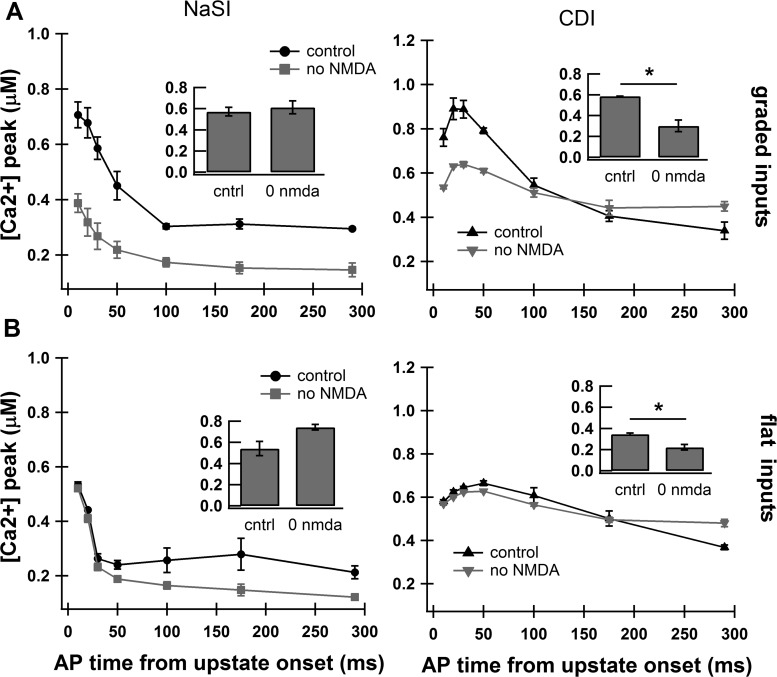
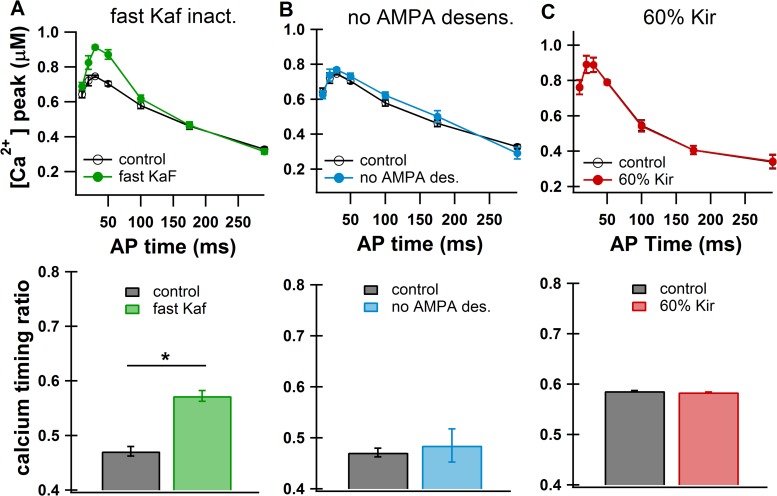
The striatum of the basal ganglia demonstrates distinctive upstate and downstate membrane potential oscillations during slow-wave sleep and under anesthetic. The upstates generate calcium transients in the dendrites, and the amplitude of these calcium transients depends strongly on the timing of the action potential (AP) within the upstate. Calcium is essential for synaptic plasticity in the striatum, and these large calcium transients during the upstates may control which synapses undergo plastic changes. To investigate the mechanisms that underlie the relationship between calcium and AP timing, we have developed a realistic biophysical model of a medium spiny neuron (MSN). We have implemented sophisticated calcium dynamics including calcium diffusion, buffering, and pump extrusion, which accurately replicate published data. Using this model, we found that either the slow inactivation of dendritic sodium channels (NaSI) or the calcium inactivation of voltage-gated calcium channels (CDI) can cause high calcium corresponding to early APs and lower calcium corresponding to later APs. We found that only CDI can account for the experimental observation that sensitivity to AP timing is dependent on NMDA receptors. Additional simulations demonstrated a mechanism by which MSNs can dynamically modulate their sensitivity to AP timing and show that sensitivity to specifically timed pre- and postsynaptic pairings (as in spike timing-dependent plasticity protocols) is altered by the timing of the pairing within the upstate. These findings have implications for synaptic plasticity in vivo during sleep when the upstate-downstate pattern is prominent in the striatum.

Keywords: calcium; computational model; medium spiny neuron; striatum; upstates.


Figures

Fig. 1.
Fig. 1.
Computational model comparison with electrophysiological data. A: morphology of model medium spiny neuron (MSN), not to scale. Soma is 16 μm in diameter, primary dendrites are 12 μm long, secondary dendrites are 14 μm long, and tertiary dendrites are divided into 11 contiguous 18-μm-long segments. B: experimental and model voltage responses to somatic current injection of 260 pA. Both demonstrate long latency to first action potential (AP). Scale bars: vertical, 10 mV; horizontal, 100 ms. C: experimental and model voltage traces showing synaptically evoked upstates. Scale bars: vertical, 10 mV; horizontal, 100 ms. Experimental upstate is a spontaneous upstate recorded from organotypic triple co-culture (Blackwell KT and Plenz D, unpublished observations). D: in vivo upstate traces show variability in upstate shape. Scale bars: vertical, 5 mV; horizontal, 1 s. [Traces used with permission from John Reynolds (unpublished observations)].
Fig. 2.
Fig. 2.
Intrinsic calcium signaling in the model matches published data. A: schematic drawing of dendritic segment showing diffusion of calcium between shells, extrusion of calcium via pumps, and influx of calcium via voltage-gated calcium channels (VGCCs). B: model calcium signal (normalized to the signal seen at the soma) strongly responds to a single backpropagating AP in proximal dendrites. When sodium channels are removed from the dendrites to represent tetrodotoxin (TTX dend), calcium decreases with distance from the soma (similar to Fig. 7G in Kerr and Plenz 2002). cntrl, Control; prim, primary; sec, secondary; tert, tertiary. C: model calcium signal (normalized to tertiary dendrite segment 1, 42 μm from soma) in distal dendrites does not strongly respond to backpropagating AP (similar to D1 neurons in Fig. 1D in Day et al. 2008). Dist, distance. D: the contribution of VGCCs changes with distance from the soma even when the conductances are the same. The relative contribution of R- and L-type calcium channels is reduced in distal dendrites, whereas the relative contribution of T-type calcium channels is increased (contributions tuned to be qualitatively similar to Fig. 2 in Carter and Sabatini 2004).
Fig. 3.
Fig. 3.
Two basic mechanisms can account for the relationship between calcium elevation and AP timing during the upstate: reduced AP backpropagatation (sodium slow inactivation, NaSI) or reduced calcium response (calcium-dependent inactivation, CDI). A: reducing the backpropagation of the APs through the implementation of NaSI causes a timing-dependent reduction in the tertiary dendrite depolarization (top) and calcium response (bottom). B: reducing the calcium response to depolarization through the implementation of CDI does not cause a reduction in the depolarization of the tertiary dendrite (top) but does cause a timing-dependent reduction of the calcium response (bottom). Vm, membrane potential. C: APs were elicited at specific times by short (5 ms) somatic depolarizations during the synaptically induced upstate. There was very little difference in the shape of the upstate between the NaSI mechanism (gray) and the CDI mechanism (black). Scale bars: vertical, 20 mV; horizontal, 50 ms. D: average over 4 tertiary dendrites as a function of AP timing. E. example traces showing CDI in high-voltage-activated calcium currents from a voltage-clamped striatal neuron. Scale bars: vertical, 100 pA; horizontal, 50 ms. F: summary averaged CDI ratio (degree of reduction by end of 200 ms) for all cells (n = 5). *P < 0.00001, paired t-test.
Fig. 4.
Fig. 4.
Robustness tests. Changes in calcium parameters ±20% do not significantly change the main effect of AP timing-dependent calcium concentration for either the NaSI condition (top) or the CDI condition (bottom). MM, Michaelis-Menten pump (Kcat); CaM, calmodulin [both NH2 (N) and COOH (C) site]; cb, calbindin; NMDACa, fraction of calcium through NMDA receptor; L13, L-type calcium channel Cav1.3; L12, L-type calcium channel Cav1.2; N, N-type calcium channel; R, R-type calcium channel; T, T-type calcium channel. Values are means ± SE. Solid black line represents mean for control condition, and dotted black lines indicate ±SE for control condition.
Fig. 5.
Fig. 5.
Input pattern affects calcium dependence on AP timing. A: subthreshold upstates of varying gradient patterns (see G1–G4 in B) as measured at the soma. B: schematic of input patterns (not to scale; see appendix Table A6). C: example traces of calcium in tertiary dendrites during each input pattern (no AP). D: average of 4 tertiary dendrites as a function of AP timing for each input pattern. E: calcium timing ratio for each input pattern, averaged over 4 tertiary dendrites for 1 random seed. Values are means ± SE.
Fig. 6.
Fig. 6.
Distance from soma affects calcium dependence on AP timing. A: morphology (not to scale) of 1 dendritic branch color-coded dark to light for increasing distance from soma. Example calcium traces for each dendritic segment, primary (P), secondary (S), tertiary1 (T1), tertiary2 (T2), and tertiary3 (T3), are shown for both NaSI and CDI. Scale bars: vertical, 0.1 μM; horizontal, 100 ms. B: calcium dependence on AP timing for NaSI condition is most prominent at the proximal tertiary dendritic segment (T1). Inset: bar graph showing the calcium timing ratio between the calcium peak for early (highest point) and late (average of 2 last points) APs for each dendritic segment. Values are means ± SD. C: same as B, but for CDI condition.
Fig. 7.
Fig. 7.
Dependence on NMDA receptors during flat and graded inputs. A: graded inputs result in a strong relationship between calcium signal and AP timing during the upstate. The calcium dependence on AP timing is reduced when the NMDA receptor is blocked only in the CDI condition. Note that the peak calcium elevations, but not the relationship between calcium and AP timing (calcium timing ratio, inset), are changed in the NaSI condition. Inset: bar graph showing the calcium timing ratio. Values are means ± SD. *P < 0.0001. B: when the upstate is elicited by flat input trains, the dependence of calcium peak on AP timing is reduced and the phenomenon is more weakly dependent on NMDA. Again, this NMDA dependence is observed for CDI but not NaSI. Inset: bar graph showing the calcium timing ratio.
Fig. 8.
Fig. 8.
A change in intrinsic excitability alters calcium relationship with AP timing. A: an increase in fast potassium A current (Kaf) inactivation speed (green) caused an increase in the strength of the calcium relationship with AP timing (*P < 0.005). Synaptic input with gradient G1 (see Fig. 5) was used to generate upstates to avoid spontaneous APs due to increased excitability. B: removing AMPA receptor desensitization (blue) did not affect the calcium relationship with AP timing. Gradient G1 was used to generate upstates. C: reducing inwardly rectifying potassium current (Kir) by 40% (red) did not affect the calcium relationship with AP timing.
Fig. 9.
Fig. 9.
Preference for calcium binding partners differs with AP timing and AP number. A: peak bound calmodulin C site (CaMC) is sensitive to AP number (gray) but not AP time (black). B: peak bound calmodulin N site (CaMN) is sensitive to AP time (black) but not AP number (gray). Values are means ± SE.
Fig. 10.
Fig. 10.
Spike timing-dependent plasticity (STDP) can occur during an upstate. NMDA receptor-mediated calcium in the spine head shows an STDP curve shape early and late in the upstate (filled squares), which requires the AP. Cntrl, NMDA stimulation alone; Δt, stimulation time relative to the AP. Inset: schematic of early and late AP with stimulation times (not to scale) during the upstate. Vertical lines represent timing of AP; dots represent timing of presynaptic stimulation.

Similar articles

Cited by

References

    1. Akopian G, Walsh JP. Reliable long-lasting depression interacts with variable short-term facilitation to determine corticostriatal paired-pulse plasticity in young rats. J Physiol 580: 225–240, 2007 - PMC - PubMed
    1. Allbritton NL, Meyer T, Stryer L. Range of messenger action of calcium ion and inositol 1,4,5-trisphosphate. Science 258: 1812–1815, 1992 - PubMed
    1. Azdad K, Chàvez M, Don Bischop P, Wetzelaer P, Marescau B, De Deyn PP, Gall D, Schiffmann SN. Homeostatic plasticity of striatal neurons intrinsic excitability following dopamine depletion. PLoS One 4: e6908, 2009 - PMC - PubMed
    1. Bargas J, Howe A, Eberwine J, Cao Y, Surmeier DJ. Cellular and molecular characterization of Ca2+ currents in acutely isolated, adult rat neostriatal neurons. J Neurosci 14: 6667–6686, 1994 - PMC - PubMed
    1. Berlanga ML, Price DL, Phung BS, Giuly R, Terada M, Yamada N, Cyr M, Caron MG, Laakso A, Martone ME, Ellisman MH. Multiscale imaging characterization of dopamine transporter knockout mice reveals regional alterations in spine density of medium spiny neurons. Brain Res 1390: 41–49, 2011 - PMC - PubMed

Publication types

LinkOut - more resources