

Identification of CaV channel types expressed in muscle afferent neurons
- PMID: 23843437
- PMCID: PMC4042423
- DOI: 10.1152/jn.00069.2013
Identification of CaV channel types expressed in muscle afferent neurons
Abstract
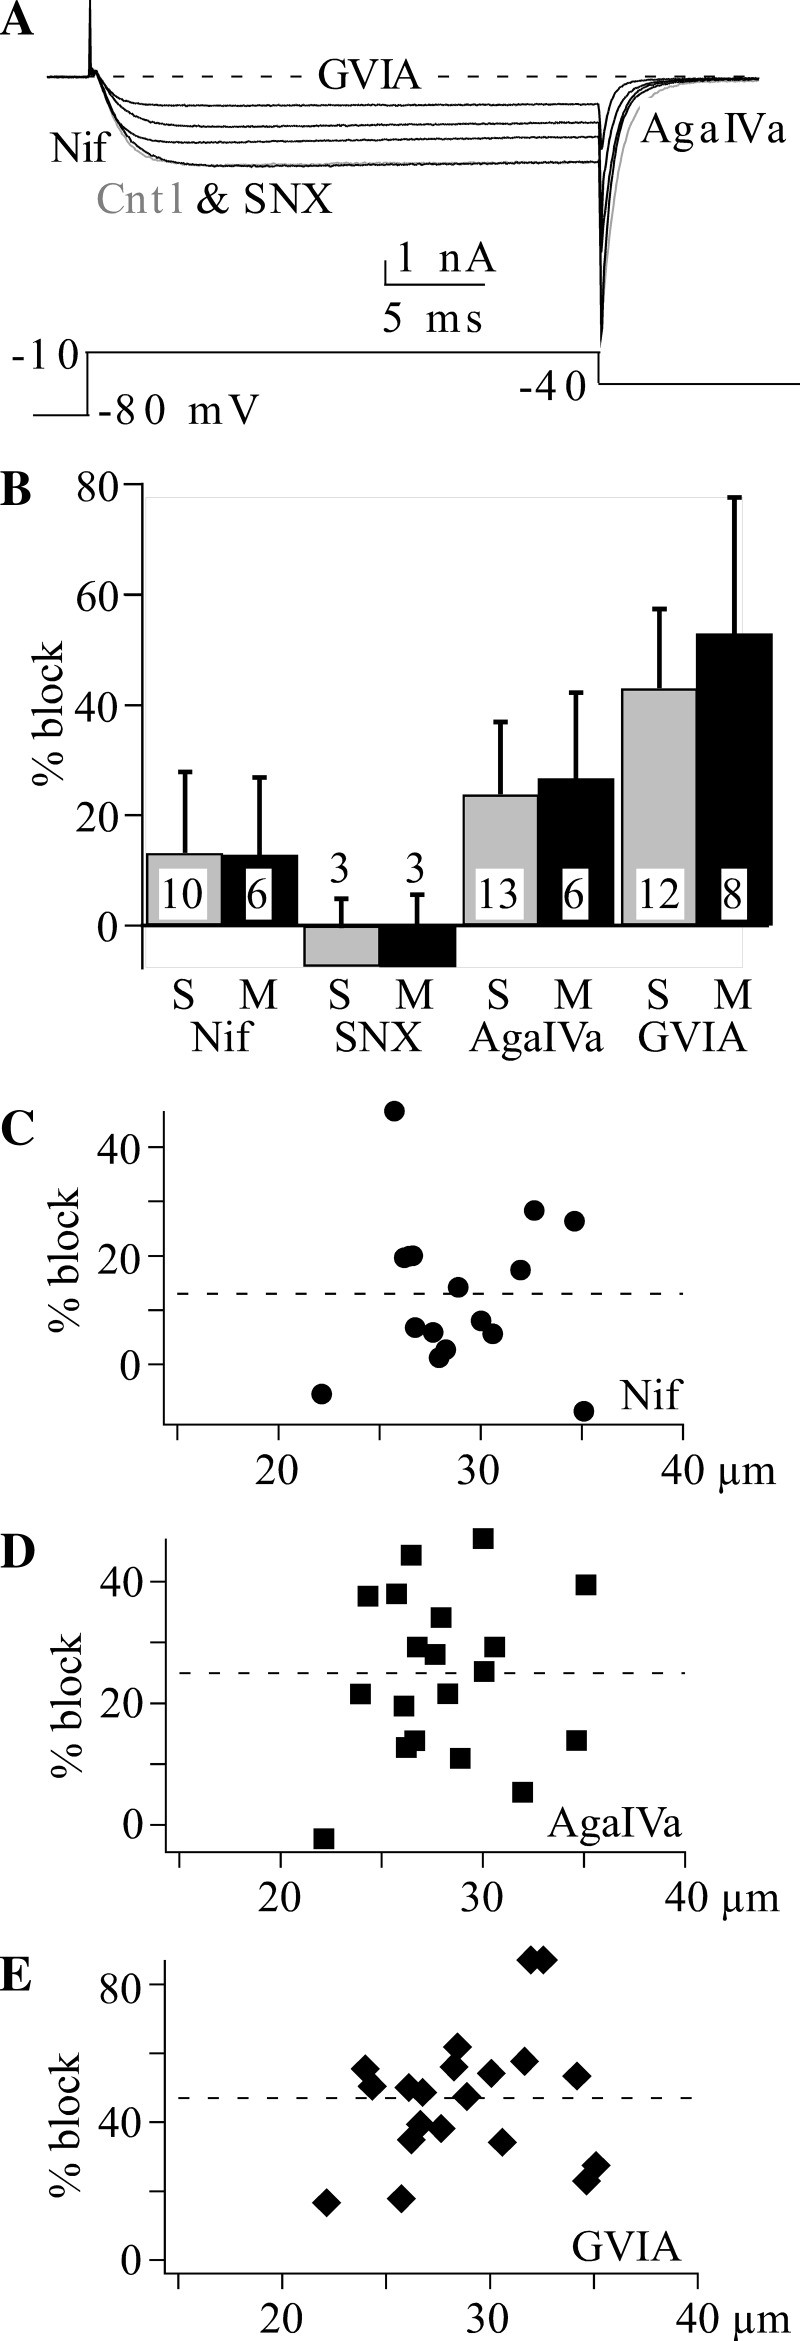
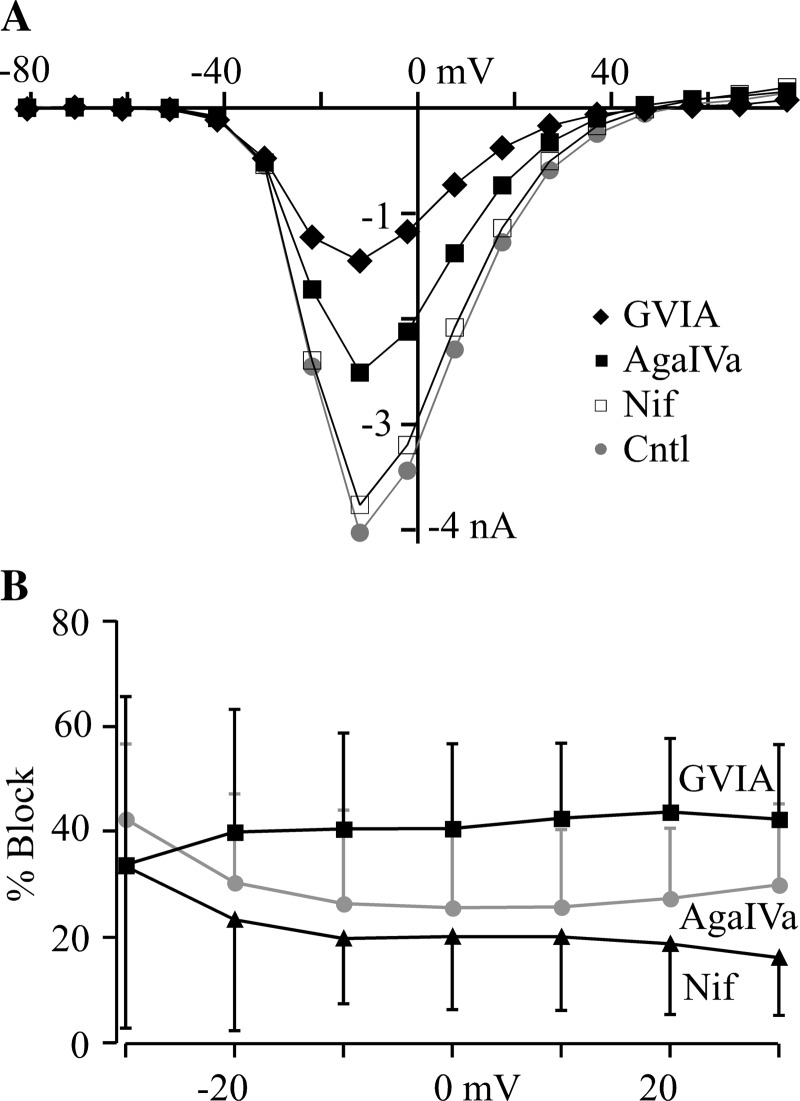
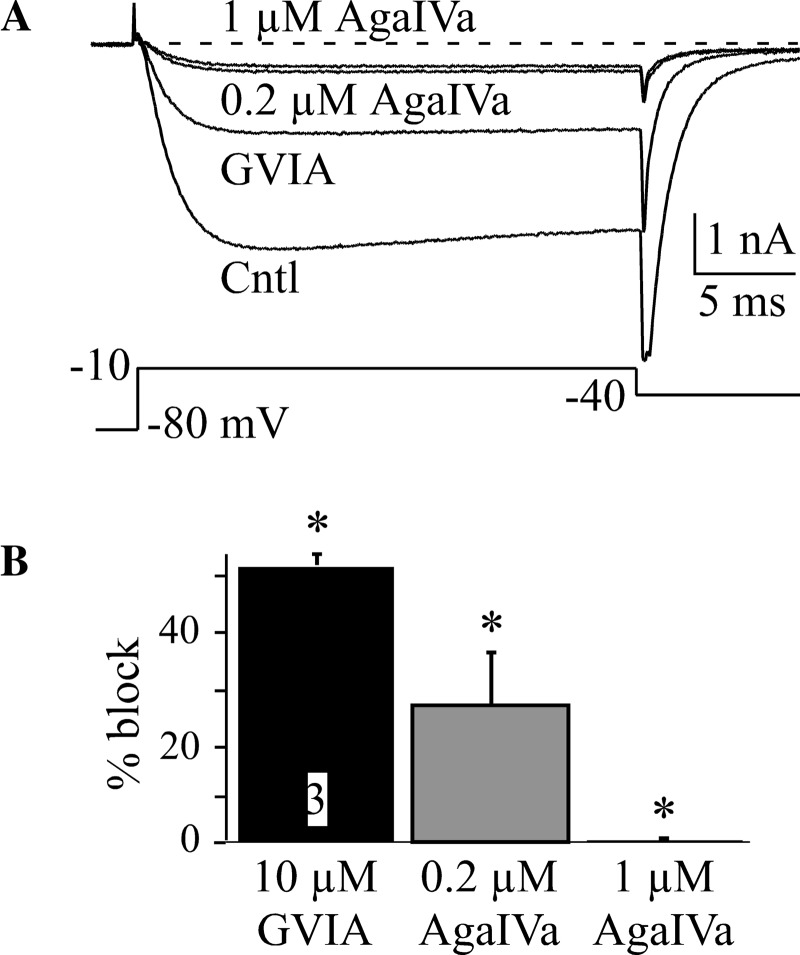
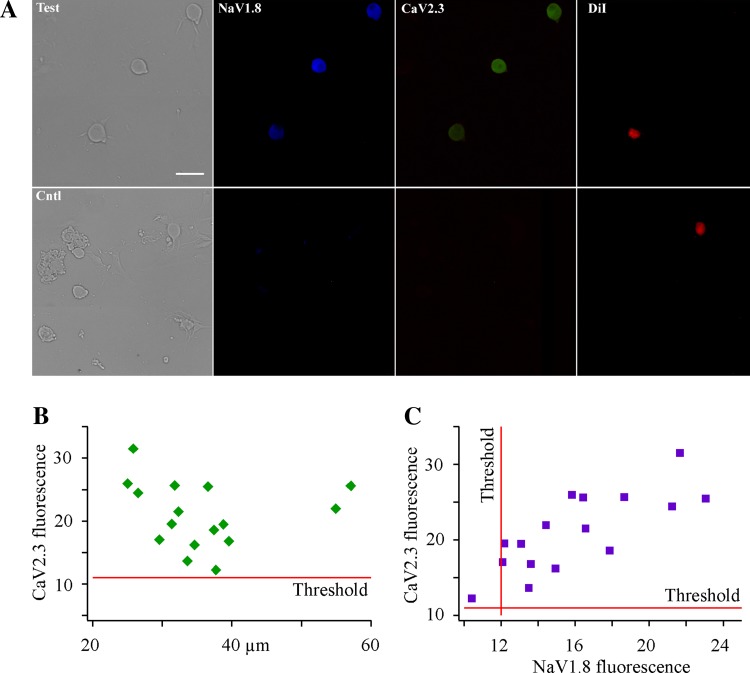
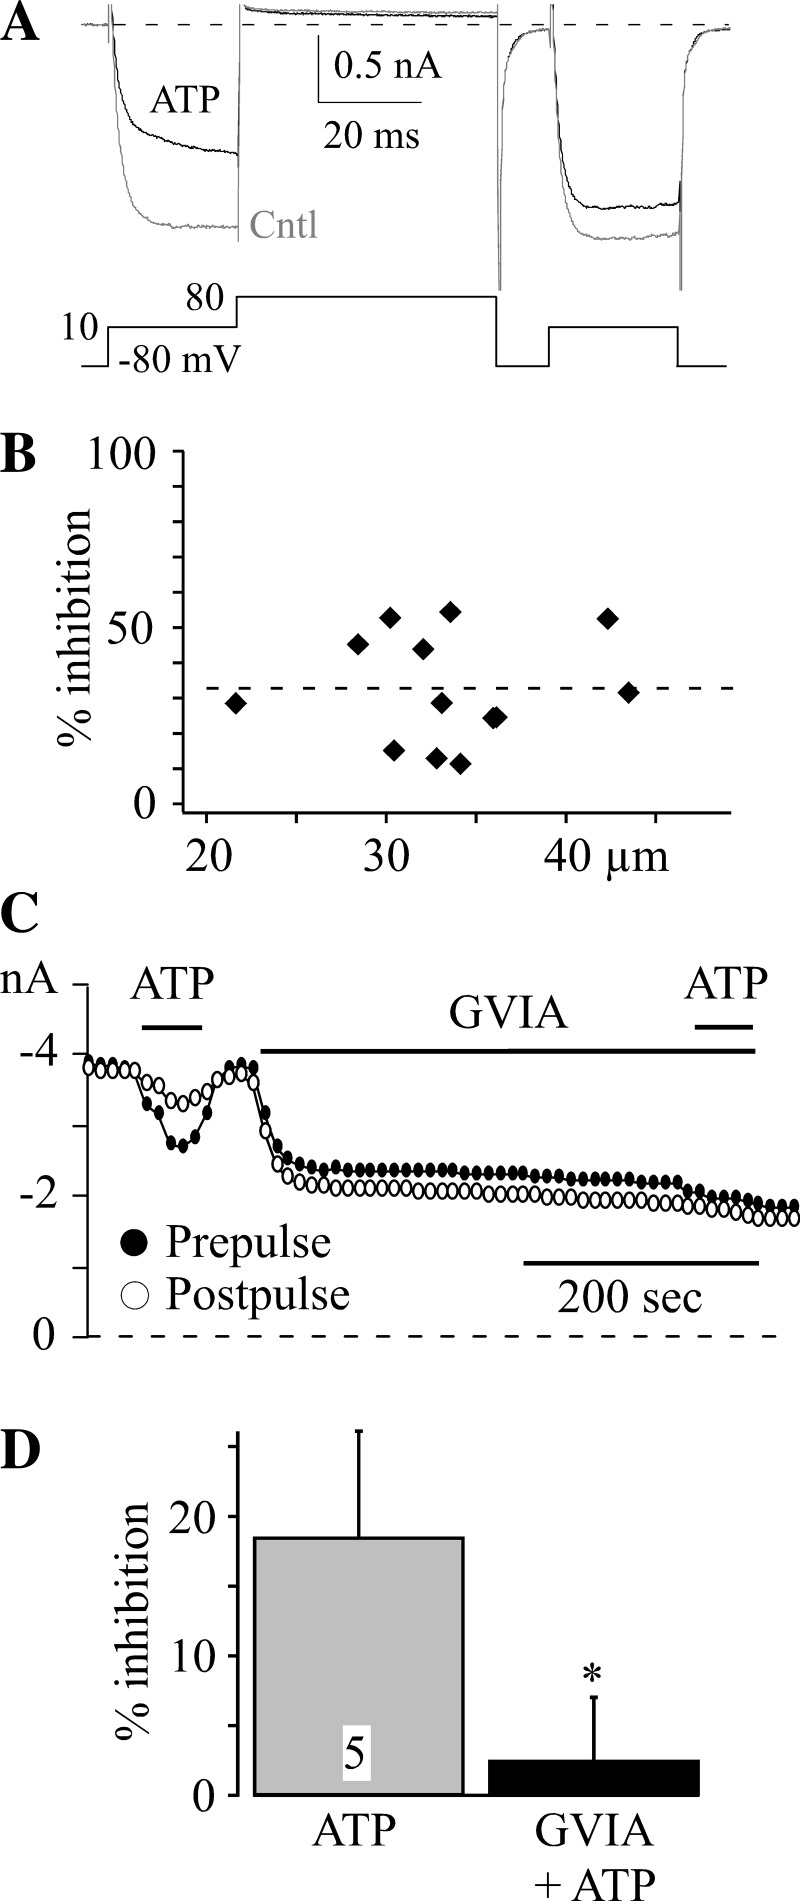
Cardiovascular adjustments to exercise are partially mediated by group III/IV (small to medium) muscle afferents comprising the exercise pressor reflex (EPR). However, this reflex can be inappropriately activated in disease states (e.g., peripheral vascular disease), leading to increased risk of myocardial infarction. Here we investigate the voltage-dependent calcium (CaV) channels expressed in small to medium muscle afferent neurons as a first step toward determining their potential role in controlling the EPR. Using specific blockers and 5 mM Ba(2+) as the charge carrier, we found the major calcium channel types to be CaV2.2 (N-type) > CaV2.1 (P/Q-type) > CaV1.2 (L-type). Surprisingly, the CaV2.3 channel (R-type) blocker SNX482 was without effect. However, R-type currents are more prominent when recorded in Ca(2+) (Liang and Elmslie 2001). We reexamined the channel types using 10 mM Ca(2+) as the charge carrier, but results were similar to those in Ba(2+). SNX482 was without effect even though ∼27% of the current was blocker insensitive. Using multiple methods, we demonstrate that CaV2.3 channels are functionally expressed in muscle afferent neurons. Finally, ATP is an important modulator of the EPR, and we examined the effect on CaV currents. ATP reduced CaV current primarily via G protein βγ-mediated inhibition of CaV2.2 channels. We conclude that small to medium muscle afferent neurons primarily express CaV2.2 > CaV2.1 ≥ CaV2.3 > CaV1.2 channels. As with chronic pain, CaV2.2 channel blockers may be useful in controlling inappropriate activation of the EPR.
Keywords: CaV2.1; CaV2.2; CaV2.3; dorsal root ganglia neurons; exercise pressor reflex.
Figures


Similar articles
-
NaV1.9 channels in muscle afferent neurons and axons.J Neurophysiol. 2018 Sep 1;120(3):1032-1044. doi: 10.1152/jn.00573.2017. Epub 2018 May 30. J Neurophysiol. 2018. PMID: 29847236 Free PMC article.
-
Voltage-gated potassium channel dysfunction in dorsal root ganglia contributes to the exaggerated exercise pressor reflex in rats with chronic heart failure.Am J Physiol Heart Circ Physiol. 2021 Aug 1;321(2):H461-H474. doi: 10.1152/ajpheart.00256.2021. Epub 2021 Jul 16. Am J Physiol Heart Circ Physiol. 2021. PMID: 34270374 Free PMC article.
-
Tetrodotoxin-resistant voltage-dependent sodium channels in identified muscle afferent neurons.J Neurophysiol. 2012 Oct;108(8):2230-41. doi: 10.1152/jn.00219.2012. Epub 2012 Aug 1. J Neurophysiol. 2012. PMID: 22855776 Free PMC article.
-
Small Molecules as Modulators of Voltage-Gated Calcium Channels in Neurological Disorders: State of the Art and Perspectives.Molecules. 2022 Feb 15;27(4):1312. doi: 10.3390/molecules27041312. Molecules. 2022. PMID: 35209100 Free PMC article. Review.
-
Calcium Homeostasis, Transporters, and Blockers in Health and Diseases of the Cardiovascular System.Int J Mol Sci. 2023 May 15;24(10):8803. doi: 10.3390/ijms24108803. Int J Mol Sci. 2023. PMID: 37240147 Free PMC article. Review.
Cited by
-
Peripheral Voltage-Gated Cation Channels in Neuropathic Pain and Their Potential as Therapeutic Targets.Front Pain Res (Lausanne). 2021 Dec 13;2:750583. doi: 10.3389/fpain.2021.750583. eCollection 2021. Front Pain Res (Lausanne). 2021. PMID: 35295464 Free PMC article. Review.
-
Inhibition of α9α10 nicotinic acetylcholine receptors prevents chemotherapy-induced neuropathic pain.Proc Natl Acad Sci U S A. 2017 Mar 7;114(10):E1825-E1832. doi: 10.1073/pnas.1621433114. Epub 2017 Feb 21. Proc Natl Acad Sci U S A. 2017. PMID: 28223528 Free PMC article.
-
Cardiac ion channels.Channels (Austin). 2015;9(6):352-9. doi: 10.1080/19336950.2015.1076597. Epub 2015 Aug 20. Channels (Austin). 2015. PMID: 26556552 Free PMC article. Review.
-
Serotonin-Mediated Activation of Serotonin Receptor Type 1 Oppositely Modulates Voltage-Gated Calcium Channel Currents in Rat Sensory Neurons Innervating Hindlimb Muscle.Mol Pharmacol. 2022 May;101(5):309-321. doi: 10.1124/molpharm.121.000419. Epub 2022 Feb 19. Mol Pharmacol. 2022. PMID: 35184045 Free PMC article.
-
NaV1.9 channels in muscle afferent neurons and axons.J Neurophysiol. 2018 Sep 1;120(3):1032-1044. doi: 10.1152/jn.00573.2017. Epub 2018 May 30. J Neurophysiol. 2018. PMID: 29847236 Free PMC article.
References
-
- Baccelli G, Reggiani P, Mattioli A, Corbellini E, Garducci S, Catalano M. The exercise pressor reflex and changes in radial arterial pressure and heart rate during walking in patients with arteriosclerosis obliterans. Angiology 50: 361–374, 1999 - PubMed
-
- Bakke EF, Hisdal J, Jorgensen JJ, Kroese A, Stranden E. Blood pressure in patients with intermittent claudication increases continuously during walking. Eur J Vasc Endovasc Surg 33: 20–25, 2007 - PubMed
-
- Bourinet E, Soong TW, Sutton K, Slaymaker S, Mathews E, Monteil A, Zamponi GW, Nargeot J, Snutch TP. Splicing of alpha 1A subunit gene generates phenotypic variants of P- and Q-type calcium channels. Nat Neurosci 2: 407–415, 1999 - PubMed
Publication types
MeSH terms
Substances
Grants and funding
LinkOut - more resources
Full Text Sources
Other Literature Sources
Research Materials
Miscellaneous