. 2014 Dec;24(12):3195-208.
doi: 10.1093/cercor/bht177. Epub 2013 Jul 10.

Dopaminergic modulation of GABAergic transmission in the entorhinal cortex: concerted roles of α1 adrenoreceptors, inward rectifier K⁺, and T-type Ca²⁺ channels

Affiliations

Dopaminergic modulation of GABAergic transmission in the entorhinal cortex: concerted roles of α1 adrenoreceptors, inward rectifier K⁺, and T-type Ca²⁺ channels

Nicholas I Cilz et al. Cereb Cortex. 2014 Dec.

Abstract

Whereas the entorhinal cortex (EC) receives profuse dopaminergic innervations from the midbrain, the effects of dopamine (DA) on γ-Aminobutyric acid (GABA)ergic interneurons in this brain region have not been determined. We probed the actions of DA on GABAA receptor-mediated synaptic transmission in the EC. Application of DA increased the frequency, not the amplitude, of spontaneous IPSCs (sIPSCs) and miniature IPSCs (mIPSCs) recorded from entorhinal principal neurons, but slightly reduced the amplitude of the evoked IPSCs. The effects of DA were unexpectedly found to be mediated by α1 adrenoreceptors, but not by DA receptors. DA endogenously released by the application of amphetamine also increased the frequency of sIPSCs. Ca(2+) influx via T-type Ca(2+) channels was required for DA-induced facilitation of sIPSCs and mIPSCs. DA depolarized and enhanced the firing frequency of action potentials of interneurons. DA-induced depolarization was independent of extracellular Na(+) and Ca(2+) and did not require the functions of hyperpolarization-activated (Ih) channels and T-type Ca(2+) channels. DA-generated currents showed a reversal potential close to the K(+) reversal potential and inward rectification, suggesting that DA inhibits the inward rectifier K(+) channels (Kirs). Our results demonstrate that DA facilitates GABA release by activating α1 adrenoreceptors to inhibit Kirs, which further depolarize interneurons resulting in secondary Ca(2+) influx via T-type Ca(+) channels.

Keywords: GABAA receptor; depolarization; entorhinal; interneuron; synapse; synaptic transmission.


Figures

Figure 1.
Figure 1.
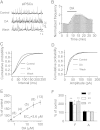
DA increases the frequency but not the amplitude of sIPSCs recorded from entorhinal neurons. (A) sIPSCs recorded from a layer II stellate neuron before, during, and after the application of DA (100 μM). (B) Time course of the sIPSC frequency averaged from 13 stellate neurons. (C) Cumulative frequency distribution from a layer II stellate neuron before, during, and after the application of DA. (D) Cumulative amplitude distribution from the same cell before, during, and after the application of DA. The flat line part of the curves was generated because zero events were detected at the amplitudes below threshold. (E) Concentration–response curve of DA. Numbers in the parenthesis are the numbers of cells recorded. (F) Bath application of DA (100 μM) significantly enhanced the frequency (F) with no effects on the amplitude (A) of sIPSCs recorded from the pyramidal neurons in layer II (L2), layer III (L3), and layer V (L5). *P < 0.05, **P < 0.01.
Figure 2.
Figure 2.
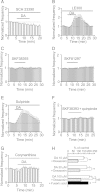
DA facilitates sIPSC frequency via the activation of α1 adrenoreceptors, but not DA receptors. (A) Pretreatment of slices with and continuous bath application of the D1-like receptor antagonist, SCH23390 (10 μM), blocked DA-induced facilitation of sIPSC frequency. (B) Application of another D1-like receptor antagonist, LE300 (100 nM), in the same fashion failed to block DA-mediated enhancement of sIPSC frequency. (C) Bath application of the selective D1-like receptor agonist, SKF38393 (20 μM), did not increase sIPSC frequency. (D) Bath application of SKF81297 (20 μM), another selective D1-like receptor agonist, failed to facilitate the frequency of sIPSCs. (E) Application the D2-like receptor antagonist, sulpiride (100 μM), failed to alter DA-induced facilitation of sIPSC frequency significantly. (F) Bath application of the D1- and D2-like receptors agonists did not enhance the frequency of sIPSCs. (G) Application of the selective α1 antagonist, corynanthine (100 μM), blocked DA-induced enhancement of sIPSC frequency. (H) Application of another α1 antagonist, doxazosin (25 μM), failed to block DA-induced increases in sIPSC frequency at 10, 30, and 100 μM and in the presence of the dopamine-β-hydroxylase inhibitor, fusaric acid (100 μM), DA still increased sIPSC frequency. **P < 0.01, N.S., no significance.
Figure 3.
Figure 3.
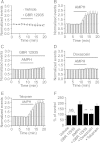
Endogenously released DA enhances sIPSC frequency via the activation of α1 receptors. (A) Bath application of the DAT inhibitor, GBR 12935 (5 μM), had no significant effect on sIPSC frequency compared with that of vehicle (0.1% DMSO). (B) Bath application of AMPH (100 μM) significantly increased the frequency of sIPSCs. (C) In the presence of GBR 12935, bath application of AMPH (100 μM) induced a significantly smaller increase in sIPSC frequency. (D) AMPH-mediated increase in sIPSC frequency was blocked by α1 receptor antagonist, doxazosin (25 μM). (E) Application of talopram (1 μM) failed to alter AMPH-induced enhancement of sIPSC frequency. (F) Summary bar graph. n.s., no significant difference; **P < 0.01 compared with AMPH alone.
Figure 4.
Figure 4.
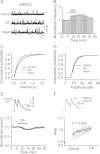
DA augments the frequency with no effects on the amplitude of mIPSCs recorded in the presence of TTX, but attenuates the amplitude of eIPSC. (A) mIPSC current traces recorded from a stellate neuron before, during, and after the application of DA. (B) Time course of mIPSC frequency summarized from 6 stellate neurons. (C) Cumulative frequency distribution of mIPSCs before, during, and after the application of DA. Note that DA reduced the interval of mIPSCs suggesting an increase in mIPSC frequency. (D) Cumulative amplitude distribution of mIPSCs before, during, and after the application of DA. Note that DA did not change the amplitude of mIPSCs. The flat line part of the curves was generated because zero events were detected at the amplitudes below threshold. (E) DA depressed the amplitude of eIPSCs recorded from layer II stellate neurons by application of a protocol comprising paired stimulation (50 ms interval at 0.1 Hz). The amplitudes of the eIPSCs evoked by the first stimulation were normalized to the average of the 5 min before application of DA. Upper panel shows the average of 6 eIPSCs before and during the application of DA. (F) DA increased the PPR. Upper panel shows the eIPSCs before and during the application of DA scaled to the amplitude evoked by the first stimulation. Note that the amplitude of the second eIPSC in the presence of DA is larger than control.
Figure 5.
Figure 5.
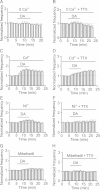
Ca2+ influx via T-type Ca2+ channels is required for DA-induced facilitation of GABAergic transmission. (A and B) Depletion of extracellular Ca2+ by replacing extracellular Ca2+ with Mg2+ and inclusion of 1 mM EGTA in the extracellular solution prevented DA-induced enhancement of sIPSC (A) and mIPSC (B) frequency. (C and D) Bath application of the high-threshold voltage-gated Ca2+ channel blocker, Cd2+ (100 μM), failed to block DA-induced enhancement of sIPSC (C) and mIPSC (D) frequency. (E and F) Bath application of the low-threshold T-type Ca2+ channel blocker, Ni2+ (200 μM), significantly reduced DA-induced augmentation of sIPSC frequency (E) and blocked DA-mediated increment of mIPSC frequency (F). (G and H) Bath application of the T-type Ca2+ channel blocker, mibefradil (15 μM), significantly reduced DA-induced increase of sIPSC frequency (G) and blocked DA-mediated enhancement of mIPSC frequency (H).
Figure 6.
Figure 6.
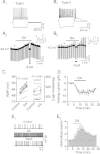
DA depolarizes GABAergic interneurons in the EC. (A1 and A2) Bath application of DA generated membrane depolarization and increased the input resistance of Type I interneurons in the EC. (A1) Voltage changes in response to current injection (±150 pA) in a Type I interneuron. (A2) Application of DA (100 μM) generated membrane depolarization and increased input resistance in the same interneuron. RMP was recorded in the current-clamp mode and a hyperpolarizing current (−50 pA, 500 ms) was injected every 20 s to measure the input resistance. Note that DA generated depolarization and increased the input resistance. To exclude the influence of DA-induced membrane depolarization on the input resistance, a negative current (−8 pA indicated by the horizontal bar) was injected briefly to bring the membrane potential back to the initial level. Under these conditions, the voltage responses induced by the injection of hyperpolarizing currents (−50 pA, 500 ms) were still larger compared with control, suggesting that DA-induced increases in input resistance are not secondary to its effect on membrane depolarization. Inset is the voltage traces taken before (a) and during (b) the application of DA when the negative current was injected. (B1 and B2) Bath application of DA generated membrane depolarization and increased the input resistance of Type II interneurons in the EC. The experiment was performed in the same fashion as Type I interneurons. (C) Pooled data for DA induced depolarization (left) and increase in input resistance (right). Empty circles represent values from individual cells and solid symbols denote the average values. (D) Application of DA induced an inward HC in interneurons (n = 5). (E1 and E2) Bath application of DA increased AP firing frequency in interneurons. APs were evoked by injecting a positive current to elevate the membrane potential just above the threshold for firing. (E1) APs recorded from an interneuron before, during, and after the application of DA. (E2) Pooled time course of AP firing (n = 7).
Figure 7.
Figure 7.
DA-induced depolarization of interneurons does not require the function of Ih channels and is independent of extracellular Na+ and Ca2+, but is affected by intracellular Ca2+ concentration. (A) Bath application of the Ih channel blocker, ZD7288 (20 μM), did not block DA-induced depolarization. (B) Replacement of extracellular NaCl with NMDG-Cl did not alter DA-induced depolarization. (C) Substitution of extracellular Ca2+ with Mg2+ and inclusion of EGTA (1 mM) in the extracellular solution failed to change DA-induced depolarization. (D) Inclusion of Ni2+ (200 μM) in the extracellular solution did not block DA-induced depolarization. (E) Inclusion of BAPTA (10 mM) in the recording pipettes reduced DA-induced depolarization, suggesting that intracellular Ca2+ concentration is related to DA-induced depolarization possibly by affecting Ca2+-dependent intracellular signals. (F) Intracellular application of thapsigargin (10 μM) via the recording pipettes failed to modify DA-mediated depolarization, suggesting that intracellular Ca2+ release is not required for DA-mediated depolarization. (G) Pooled data.
Figure 8.
Figure 8.
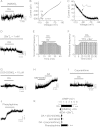
DA-induced depolarization of interneurons is mediated by inhibition of Kirs. (A) DA did not induce conspicuous depolarization when the intracellular K+ was replaced with NMDG. (B) Current–voltage relationship recorded by a ramp protocol (from −110 to −50 mV) in the extracellular solution containing 3.5 mM K+ before and during the application of DA. Traces in the figure were averaged traces from 5 cells. (C) The DA-generated net current obtained by subtraction of the control from that in the presence of DA has a reversal potential at approximately −85.6 mV close to the calculated K+ reversal potential (∼ −85.4 mV). Note that the DA-sensitive current showed an inward rectification. (D) Bath application of Ba2+ blocked DA-induced depolarization. (E) Bath application of Ba2+ increased sIPSC frequency and subsequent application of DA slightly reduced sIPSC frequency. (F) Bath application of Ba2+ increased mIPSC frequency and blocked DA-induced increases in mIPSC frequency. (G) Pretreatment of slices with and continuous bath application of SCH23390 blocked DA-induced depolarization. (H) Bath application of SKF38393 (40 μM) did not induce depolarization, but subsequent application of DA still induced depolarization in the same cell. (I) Pretreatment of slices with and continuous bath application of corynanthine (100 μM) blocked DA-induced depolarization. (J) Bath application of the selective α1 receptor agonist, phenylephrine (100 μM), induced depolarization of an interneuron. (K) Pooled data. **P < 0.01 versus baseline.

Similar articles

Cited by

References

    1. Akil M, Lewis DA. The dopaminergic innervation of monkey entorhinal cortex. Cereb Cortex. 1993;3:533–550. - PubMed
    1. Anfossi G, Massucco P, Mularoni E, Mattiello L, Cavalot F, Burzacca S, Trovati M. Effect of dopamine on adenosine 3′,5′-cyclic monophosphate levels in human platelets. Gen Pharmacol. 1993;24:435–438. - PubMed
    1. Arnold SE, Hyman BT, Van Hoesen GW, Damasio AR. Some cytoarchitectural abnormalities of the entorhinal cortex in schizophrenia. Arch Gen Psychiatry. 1991;48:625–632. - PubMed
    1. Avoli M, D'Antuono M, Louvel J, Kohling R, Biagini G, Pumain R, D'Arcangelo G, Tancredi V. Network and pharmacological mechanisms leading to epileptiform synchronization in the limbic system in vitro. Prog Neurobiol. 2002;68:167–207. - PubMed
    1. Bao J, Li JJ, Perl ER. Differences in Ca2+ channels governing generation of miniature and evoked excitatory synaptic currents in spinal laminae I and II. J Neurosci. 1998;18:8740–8750. - PMC - PubMed

Publication types

MeSH terms