. 2013 Aug 16;288(33):23875-83.
doi: 10.1074/jbc.M112.445148. Epub 2013 Jul 10.

Inhibition of protein synthesis alters protein degradation through activation of protein kinase B (AKT)

Affiliations

Inhibition of protein synthesis alters protein degradation through activation of protein kinase B (AKT)

Chun-Ling Dai et al. J Biol Chem. .

Abstract

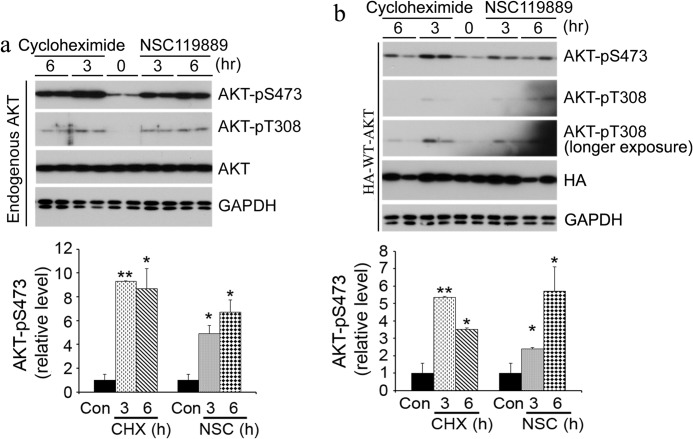
The homeostasis of protein metabolism is maintained and regulated by the rates of protein biosynthesis and degradation in living systems. Alterations of protein degradation may regulate protein biosynthesis through a feedback mechanism. Whether a change in protein biosynthesis modulates protein degradation has not been reported. In this study, we found that inhibition of protein biosynthesis induced phosphorylation/activation of AKT and led to phosphorylation of AKT target substrates, including FoxO1, GSK3α/β, p70S6K, AS160, and the E3 ubiquitin ligase MDM2. Phosphorylation of ribosomal protein S6 was also modulated by inhibition of protein biosynthesis. The AKT phosphorylation/activation was mediated mainly through the PI3K pathway because it was blocked by the PI3K inhibitor LY294002. The activated AKT phosphorylated MDM2 at Ser(166) and promoted degradation of the tumor suppressor p53. These findings suggest that inhibition of protein biosynthesis can alter degradation of some proteins through activation of AKT. This study reveals a novel regulation of protein degradation and calls for caution in blocking protein biosynthesis to study the half-life of proteins.

Keywords: AKT; Protein Degradation; Protein Synthesis; Protein Turnover; Signal Transduction.


Figures

FIGURE 1.
FIGURE 1.
Inhibition of protein synthesis induces AKT phosphorylation in HEK-293FT cells. a–d, HEK-293FT cells were transfected with plasmids expressing HA-WT AKT (a), HA-AKT-T308A/S473A (HA-AKT-2A) (b), HA-AKT-T308A (c), or HA-AKT-S473A (d) for 16 h, followed by treatment with 100 μm cycloheximide for the indicated periods of time. The levels and site-specific phosphorylation of AKT in the cell lysates were determined by Western blotting. e, quantification of AKT levels (HA blots) after normalization with GAPDH. f, upper left panel, after transfection with plasmids expressing HA-WT AKT for 16 h, equal amounts of HEK-293FT cells were treated with the indicated concentrations of cycloheximide for 3 h. The levels of AKT and its phosphorylation in the cell lysates were determined by Western blotting. Upper right panel, quantification of AKT phospho-Ser473 blots after normalization with the HA blots. Lower left panel, the total amounts of cellular proteins were also determined and are presented relative to those of untreated cells. Lower right panel, the linear correlation between AKT phospho-Ser473 and the total protein amounts is shown. g, HEK-293FT cells with (right panel) or without (left panel) FuGENE 6 pretreatment for 16 h were treated with 100 μm cycloheximide and harvested at the indicated time points. h, HEK-293FT cells were treated with 50 μm NSC119889 (NSC) for 3 h, and the cell lysates were analyzed by Western blotting. The experiments were repeated three to four times, and the graphs in e–h are quantifications of the blots and are presented as means ± S.E. *, p < 0.05; **, p < 0.01 versus 0 h or 0 μm controls.
FIGURE 2.
FIGURE 2.
Inhibition of protein synthesis induces AKT phosphorylation in N2a cells. Untransfected N2a cells (a, upper panel) or N2a cells transfected with HA-tagged WT AKT for 16 h (b, upper panel) were treated with 100 μm cycloheximide (CHX) or 50 μm NSC119889 (NSC), and the cells were then harvested at the indicated time points. The levels and site-specific phosphorylation of AKT in the cell lysates were determined by Western blotting. The lower panels show quantifications of the blots. Con, control. *, p < 0.05; **, p < 0.01 versus 0 h controls.
FIGURE 3.
FIGURE 3.
Inhibition of protein synthesis induces phosphorylation of AKT substrates. a, upper panel, HEK-293FT cells were transfected with HA-WT AKT for 16 h, followed by treatment with 100 μm cycloheximide (CHX) for 3 h. The levels and phosphorylation of AKT and its substrates were analyzed by Western blotting. b and c, upper panels, HEK-293FT cells were treated with 100 μm cycloheximide (b) or 50 μm NSC119889 (NSC; c) for the indicated periods of time, and the cell lysates were analyzed. The lower panels show the densitometric quantification (mean ± S.D.) of the phosphorylation of individual AKT substrates calculated after being normalized to the levels of the corresponding proteins. Con, control. *, p < 0.05; **, p < 0.01 versus 0-h controls.
FIGURE 4.
FIGURE 4.
LY294002 and rapamycin inhibit AKT phosphorylation induced by cycloheximide. a, HEK-293FT cells were treated with 100 μm cycloheximide (CHX), 10 μm LY294002 (LY), or 100 nm rapamycin (Rap) alone or in combination for 3 or 24 h, followed by analysis of the levels and phosphorylation of AKT by Western blotting. The GAPDH blot was included as a loading control. b, quantification of the blots shown in a. The relative AKT phosphorylation (mean ± S.E.) after being normalized to the total AKT levels is shown. c, HEK-293FT cells transfected with WT AKT for 16 h were treated with cycloheximide, LY294002, or rapamycin for 3 or 24 h, followed by analysis of the levels and phosphorylation of AKT by Western blotting. exp, exposure; Con, control. *, p < 0.05; **, p < 0.01.
FIGURE 5.
FIGURE 5.
Cycloheximide induces p53 turnover through activation of AKT. a, HEK-293FT cells were pretreated with or without 20 μm LY294002 for 1 h, followed by treatment with 100 μm cycloheximide for the indicated periods of time. The cell lysates were then analyzed by Western blotting. b and c, quantification of the blots shown in a (left panel) in the absence of LY294002. d, quantification of p53 levels. The data are representative of three independent experiments with similar results.

References

    1. Baliga B. S., Pronczuk A. W., Munro H. N. (1969) Mechanism of cycloheximide inhibition of protein synthesis in a cell-free system prepared from rat liver. J. Biol. Chem. 244, 4480–4489 - PubMed
    1. Fulda S., Gorman A. M., Hori O., Samali A. (2010) Cellular stress responses: cell survival and cell death. Int. J. Cell Biol. 2010, 214074. - PMC - PubMed
    1. Baskić D., Popović S., Ristić P., Arsenijević N. N. (2006) Analysis of cycloheximide-induced apoptosis in human leukocytes: fluorescence microscopy using annexin V/propidium iodide versus acridine orange/ethidium bromide. Cell Biol. Int. 30, 924–932 - PubMed
    1. Ishii H. H., Etheridge M. R., Gobé G. C. (1995) Cycloheximide-induced apoptosis in Burkitt lymphoma (BJA-B) cells with and without Epstein-Barr virus infection. Immunol. Cell Biol. 73, 463–468 - PubMed
    1. Tsuchida T., Kato T., Yamada A., Kawamoto K. (2002) Cycloheximide induces apoptosis of astrocytes. Pathol. Int. 52, 181–185 - PubMed

Publication types

MeSH terms

Substances

LinkOut - more resources