. 2013 Sep 6;288(36):25895-25907.
doi: 10.1074/jbc.M113.485268. Epub 2013 Jul 10.

Heparin dodecasaccharide containing two antithrombin-binding pentasaccharides: structural features and biological properties

Affiliations

Heparin dodecasaccharide containing two antithrombin-binding pentasaccharides: structural features and biological properties

Christian Viskov et al. J Biol Chem. .

Abstract

The antithrombin (AT) binding properties of heparin and low molecular weight heparins are strongly associated to the presence of the pentasaccharide sequence AGA*IA (A(NAc,6S)-GlcUA-A(NS,3,6S)-I(2S)-A(NS,6S)). By using the highly chemoselective depolymerization to prepare new ultra low molecular weight heparin and coupling it with the original separation techniques, it was possible to isolate a polysaccharide with a biosynthetically unexpected structure and excellent antithrombotic properties. It consisted of a dodecasaccharide containing an unsaturated uronate unit at the nonreducing end and two contiguous AT-binding sequences separated by a nonsulfated iduronate residue. This novel oligosaccharide was characterized by NMR spectroscopy, and its binding with AT was determined by fluorescence titration, NMR, and LC-MS. The dodecasaccharide displayed a significantly increased anti-FXa activity compared with those of the pentasaccharide, fondaparinux, and low molecular weight heparin enoxaparin.

Keywords: 3-O-Sulfation; Antithrombin; Glycosaminoglycan; Heparin; Mass Spectrometry (MS); NMR.


Figures

FIGURE 1.
FIGURE 1.
Structure of the dodecasaccharide is shown (b). Octasaccharides having structures similar to the reducing (a) and nonreducing (c) sequences of dodecasaccharide are shown (15). ΔU, 4,5-unsaturated uronic acid.
FIGURE 2.
FIGURE 2.
Chromatogram at 232 nm of the whole dodecasaccharide fraction. Arrow indicates the peak of the dodecasaccharide with the double AT-binding site. mAU, absorbance unit from UV-visible spectroscopy.
FIGURE 3.
FIGURE 3.
Chromatogram of the depolymerization by heparinase I of the reduced dodecasaccharide detected at 232 nm (black) and 202–240 nm (red). Fragments: 1, ΔU2S-ANS,6S; 2, ΔU-ANAc,6S-GlcUA-ANS,3S,6S; 3, ΔU2S-ANS,6S-I-ANAc,6S-GlcUA-ANS,3S,6S; 4, ΔU2S-ANS,6S-I-ANAc,6S-GlcUA-ANS,3S,6S-I2S-ANS,6S-ol; 5 is the reduced starting molecule as follows: ΔU-ANAc,6S-GlcUA-ANS,3S,6S-IdoUA2S-ANS,6S-IdoUA-ANAc,6S-GlcUA-ANS,3S,6S-IdoUA2S-ANS,6S-ol. mAU, absorbance unit from UV-visible spectroscopy.
FIGURE 4.
FIGURE 4.
Superimposition of 900 MHz TOCSY (black) and NOESY (red) spectra of the dodecasaccharide. H1 I2S1 − H4 ANS1 and H1 I2S2 − H4 ANS, red inter-glycosidic NOEs are magnified in the top right side of the figure.
FIGURE 5.
FIGURE 5.
Anomeric region of the 900 MHz proton spectrum of the dodecasaccharide in the absence (a) and presence of AT (b). Shifts induced by protein of A*1, A*2, and I52S1 are shown.
FIGURE 6.
FIGURE 6.
800 MHz 1H NMR spectrum (a) and STD spectrum (b) of dodecasaccharide-AT complex.
FIGURE 7.
FIGURE 7.
Structures of 1:1 dodecasaccharide-AT assemblies. Dodecasaccharide interacting with nonreducing AGA*IA1 (a) and with the reducing AGA*IA2 (b).
FIGURE 8.
FIGURE 8.
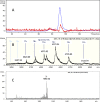
Evaluation of AT-AGA*IA interaction (1:1 molar ratio solution). A, LC SEC/UV profile at 280 nm (magenta line) and LC SEC/ESI-TOF MS profile (brown line). B, ESI-TOF spectrum (positive mode and normal conditions) corresponding to the AT-AGA*IA complex (RT range: 99.0–100.4 min; calculated Mr ∼59,383). C, ESI-TOF spectrum (negative mode and denaturing conditions) of AGA*IA (RT range: 97.7–101.1 min; calculated Mr ∼1507). mAU, absorbance unit from UV-visible spectroscopy.
FIGURE 9.
FIGURE 9.
Evaluation of AT-dodecasaccharide interaction (1:1 molar ratio). A, LC SEC/UV profile at 280 nm (blue line) and LC SEC/ESI-TOF MS profile (red line). B, ESI-TOF spectrum (positive mode and normal conditions) corresponding to the AT-dodecasaccharide complex (RT range: 91.3–95.0 min; calculated Mr ∼61,118). C, ESI-TOF spectrum (negative mode and denaturing conditions) of dodecasaccharide (RT range: 91.6–94.8 min; calculated Mr ∼3300). mAU, absorbance unit from UV-visible spectroscopy.

References

    1. Barowcliffe T. W. (2012) in Heparin: A Century of Progress (Lever R., Mulloy B., Page C. P., eds) pp. 3–22, Springer-Verlag, Berlin
    1. Lever R., Page C. P. (2012) Heparin: A Century of Progress (Lever R., Mulloy B., Page C. P., eds) pp. 281–306, Springer-Verlag, Berlin
    1. Thunberg L., Bäckström G., Lindahl U. (1982) Further characterization of the antithrombin-binding sequence in heparin. Carbohydr. Res. 100, 393–410 - PubMed
    1. Jeske W., Lormeau J. C., Callas D., Iqbal O., Hoppensteadt D., Fareed J. (1995) Antithrombin III affinity dependence on the anticoagulant, antiprotease, and tissue factor pathway inhibitor actions of heparins. Semin. Thromb. Hemost. 21, 193–200 - PubMed
    1. Petitou M., van Boeckel C. A. (2004) A synthetic antithrombin III binding pentasaccharide is now a drug! What comes next? Angew. Chem. Int. Ed. Engl. 43, 3118–3133 - PubMed

Publication types