. 2013 Jul 10;33(28):11372-89.
doi: 10.1523/JNEUROSCI.0863-13.2013.

Layer 4 in primary visual cortex of the awake rabbit: contrasting properties of simple cells and putative feedforward inhibitory interneurons

Affiliations

Layer 4 in primary visual cortex of the awake rabbit: contrasting properties of simple cells and putative feedforward inhibitory interneurons

Jun Zhuang et al. J Neurosci. .

Abstract

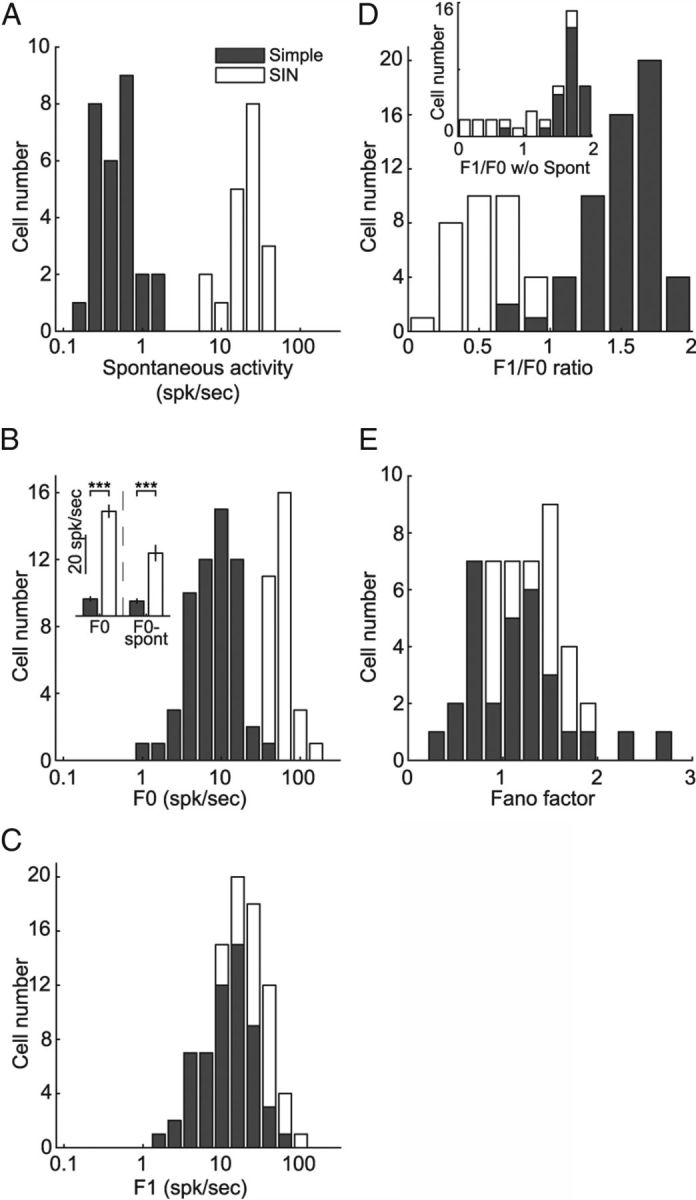
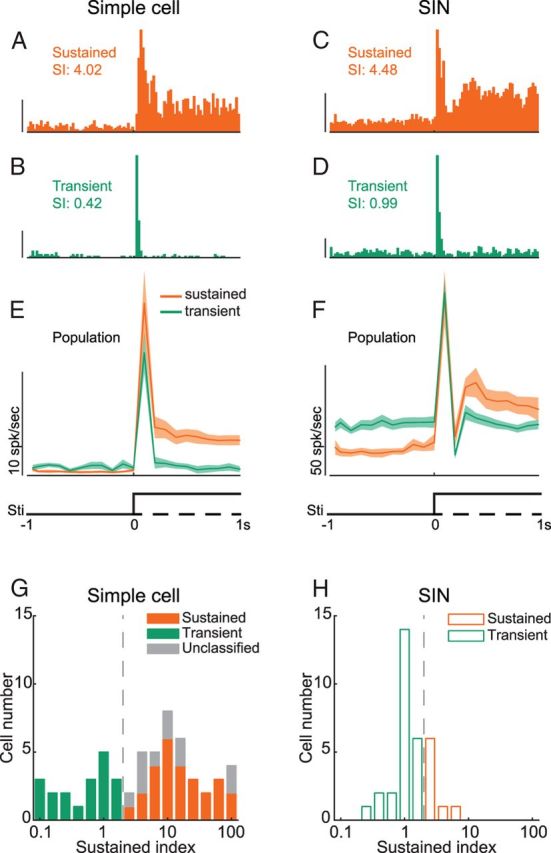
Extracellular recordings were obtained from two cell classes in layer 4 of the awake rabbit primary visual cortex (V1): putative inhibitory interneurons [suspected inhibitory interneurons (SINs)] and putative excitatory cells with simple receptive fields. SINs were identified solely by their characteristic response to electrical stimulation of the lateral geniculate nucleus (LGN, 3+ spikes at >600 Hz), and simple cells were identified solely by receptive field structure, requiring spatially separate ON and/or OFF subfields. Notably, no cells met both criteria, and we studied 62 simple cells and 33 SINs. Fourteen cells met neither criterion. These layer 4 populations were markedly distinct. Thus, SINs were far less linear (F1/F0 < 1), more broadly tuned to stimulus orientation, direction, spatial and temporal frequency, more sensitive to contrast, had much higher spontaneous and stimulus-driven activity, and always had spatially overlapping ON/OFF receptive subfields. SINs responded to drifting gratings with increased firing rates (F0) for all orientations and directions. However, some SINs showed a weaker modulated (F1) response sharply tuned to orientation and/or direction. SINs responded at shorter latencies than simple cells to stationary stimuli, and the responses of both populations could be sustained or transient. Transient simple cells were more sensitive to contrast than sustained simple cells and their visual responses were more frequently suppressed by high contrasts. Finally, cross-correlation between LGN and SIN spike trains confirmed a fast and precisely timed monosynaptic connectivity, supporting the notion that SINs are well suited to provide a fast feedforward inhibition onto targeted cortical populations.


Figures

Figure 1.
Figure 1.
Responses to thalamic electrical stimulation and spike waveform durations of different cell types. A, Conceptual diagram of a cell's response to a thalamic electrical stimulation. B–D, Distribution of spike waveform durations (B), latencies to the onset of stimulation (C), and minimal ISIs of responding spikes (D) of different cell types. “NA” in D represents cells that responded to thalamic stimulation with <2 spikes.
Figure 2.
Figure 2.
Receptive field maps, spike waveforms, perievent rasters, and PSTHs of three simple cells and a SIN. A1–A3, An example of S1 OFF simple cells. A1, Receptive field maps, grid scale: 1 degree, each contour: 12% of peak value. LSIs were shown on top of the maps. Inset, Spike waveforms, calibration: 0.4 ms, 0.1 mV. Shadowed areas represent mean ±SD. A2, Perievent rasters for two periods. For reasons of clarity, only first 40 iterations were shown. A3, PSTHs. F0 responses, F1 responses, Fano factors, and spontaneous activity were listed on the upper right corner. Unit for F0, F1, and spontaneous activity: spk/s. B1–B3, An example of S1 ON simple cell. C1–C3, An example of S2 simple cell. D1–D3, An example of SIN. Gray dashed line in D3 shows the spontaneous activity level for the SIN. The spontaneous activity levels for simple cells are too low to indicate with a dashed line.
Figure 3.
Figure 3.
Receptive field subfield structures of simple cells and SINs. A, Scatter plot of LSI against dominant subfield width from all simple cells and SINs. B, Distribution of LSI. C, Distribution of dominant subfield width. D, Distribution of dominant subfield area.
Figure 4.
Figure 4.
Spontaneous firing rates and responses to optimal drifting gratings of simple cells and SINs. A, Distribution of spontaneous firing rates. B, Distribution of F0 responses to optimal drifting gratings. Inset, SINs had significantly higher F0 responses than simple cells with or without spontaneous activity removed. ***p < 0.001. C, Distribution of F0 responses to optimal drifting gratings. D, Distribution of F1/F0 ratios. Inset, Distribution of F1/F0 ratios after removing spontaneous activity. E, Distribution of Fano factors.
Figure 5.
Figure 5.
Receptive field structures and orientation tunings of three simple cells (A–C) and three SINs (D–F). For each cell, left part shows the PSTHs to drifting gratings in four example directions (designated by the arrowheads located at upper left corner of the box). Each PSTH plots 2 periods of the stimulation. Calibration: 10 spk/s, 0.25 s. Right part shows the orientation tuning curves (fitted by von Mises distribution function, F1 for simple cells and F0 for SINs). Top right part shows the receptive subfields of the cell, each contour: 12% of peak value. Note that A represents the same cell shown in Figure 2C and B represents the same cell shown in Figure 2B. The dashed lines in PSTHs and tuning curves of SINs indicate their spontaneous activity levels. The spontaneous activity levels for simple cells are too low to indicate with a dashed line.
Figure 6.
Figure 6.
Orientation and direction tuning properties of simple cells and SINs. A, Distribution of OSIs. B, Distribution of DSIs. C, Scatter plot of OSIs against DSIs. D, Distribution of CirVars. Inset, OSI and CirVar are significantly correlated. E, Distribution of preferred directions of simple cells. Length of the each arrow represents frequency. F, Distribution of preferred orientations of simple cells. Orientation of each bar represents the orientation of stimulating drifting grating. Length of the each bar represents frequency. SUP, Superior; POS, posterior.
Figure 7.
Figure 7.
F1 responses of SINs are more orientation/direction selective than their F0 responses. A, Orientation tuning curves of F0 and F1 responses from three SINs. Gray dashed lines indicate spontaneous activity level. Note that all three SINs show F0 responses with poor orientation/direction selectivity, however, their F1 response could be unselective (left), orientation selective (middle), or direction selective (right). B–D, Scatter plot of orientation tuning parameters of F1 responses against those from F0 responses for both simple cells and SINs. (B, CirVar; C, OSI; D, DSI). E, Statistical comparisons for these parameters between F0 and F1 responses and between simple cells and SINs. F1 vs F0: paired t test. Simple vs SIN: independent t test. **p < 0.01; ***p < 0.001. N.S., Not significant, p > 0.05.
Figure 8.
Figure 8.
Sustained/transient responses of simple cells and SINs. A–D, Response PSTHs to stationary flashing visual stimuli of a sustained simple cell (A), a transient simple cell (B), a sustained SIN (C), and a transient SIN (D). SIs (ratio between sustained component to baseline, see Materials and Methods) are labeled for each cell. E, Population average for sustained and transient simple cells. F, Population average for sustained and transient SINs. Shaded area represents mean ±SEM for each bin. G, Sustained index distribution of simple cells. H, Sustained index distribution of SINs. Dashed line marks the cutoff criterion for classifying sustained and transient cells. Calibration: (in A, B, E) 10 spk/s; (in C, D, F) 50 spk/s.
Figure 9.
Figure 9.
Contrast response properties of sustained and transient cells for both simple cells and SINs. A–D, Contrast response functions of the same cells plotted in Figure 8A–D, respectively. Raw data were fitted by hyperbolic function (see Materials and Methods). C50s are labeled for each cell. E, Normalized population average contrast response function of sustained and transient simple cells. Inset, Population average contrast response functions of sustained and transient LGN cells [modified from the study by Cano et al. with permission]. F, Normalized population average contrast response functions of sustained and transient SINs. G, Comparison of C50s from these four cell groups (sustained simple cells, transient simple cell, sustained SIN, and transient SIN). Sustained vs transient: independent t test. ***p < 0.001. N.S., No significance, p > 0.05. H, Percentage of cells showing high-contrast suppression within each of these four cell groups.
Figure 10.
Figure 10.
Distribution of latencies to flash visual stimulation of simple cells and SINs. Inset, Distribution broken down into sustained/transient groups for simple cells and SINs.
Figure 11.
Figure 11.
Spatial and temporal frequency tuning properties of simple cells and SINs. A, Spatial frequency tunings of three simple cells and three SINs. Raw data were fitted by Gaussian function. Peak spatial frequency, tuning bandwidth, and pass mode (low-pass/bandpass) are labeled for each cell. B, C, Comparison of peak spatial frequency and spatial frequency tuning bandwidth between simple cells and SINs, respectively. D, Temporal frequency tunings of the same three simple cells and three SINs. Raw data were fitted by Gaussian function on logarithmic scale. Peak temporal frequency and temporal frequency tuning bandwidth are labeled for each cell. E–F, Comparison of peak temporal frequency and temporal frequency tuning bandwidth between simple cells and SINs, respectively. Dashed lines indicate spontaneous activity levels for SINs. Simple vs SIN: independent t test. N.S., No significance, p > 0.05. ***p < 0.001.
Figure 12.
Figure 12.
Layer 4 SINs receive monosynaptic thalamocortical inputs. A–E, Crosscorrelograms of five simultaneously recorded cell pairs between retinotopically aligned LGN cells and layer 4 SINs. The x-axis represents the relative timing to LGN spikes. Efficacy of each connection is shown for each crosscorrelogram. Insets, The RF maps of LGN cells and SINs. Red/blue, ON/OFF subfield of SINs, respectively. ON or OFF dominancy was labeled for each SIN. White/black patches, RF of ON/OFF centered LGN cells, respectively. Note that in C and D, a single LGN OFF-center cell contracted two layer 4 SINs, each with an ON-dominated receptive fields.

Similar articles

Cited by

References

    1. Adesnik H, Bruns W, Taniguchi H, Huang ZJ, Scanziani M. A neural circuit for spatial summation in visual cortex. Nature. 2012;490:226–231. doi: 10.1038/nature11526. - DOI - PMC - PubMed
    1. Albrecht DG, Hamilton DB. Striate cortex of monkey and cat: contrast response function. J Neurophysiol. 1982;48:217–237. - PubMed
    1. Alitto HJ, Moore BD, 4th, Rathbun DL, Usrey WM. A comparison of visual responses in the lateral geniculate nucleus of alert and anaesthetized macaque monkeys. J Physiol. 2011;589:87–99. doi: 10.1113/jphysiol.2010.190538. - DOI - PMC - PubMed
    1. Alonso JM, Martinez LM. Functional connectivity between simple cells and complex cells in cat striate cortex. Nat Neurosci. 1998;1:395–403. doi: 10.1038/1609. - DOI - PubMed
    1. Alonso JM, Swadlow HA. Thalamocortical specificity and the synthesis of sensory cortical receptive fields. J Neurophysiol. 2005;94:26–32. doi: 10.1152/jn.01281.2004. - DOI - PubMed

LinkOut - more resources