. 2013 Jul 10;33(28):11412-24.
doi: 10.1523/JNEUROSCI.0711-13.2013.

Reevaluation of the beam and radial hypotheses of parallel fiber action in the cerebellar cortex

Affiliations

Reevaluation of the beam and radial hypotheses of parallel fiber action in the cerebellar cortex

Samuel W Cramer et al. J Neurosci. .

Abstract

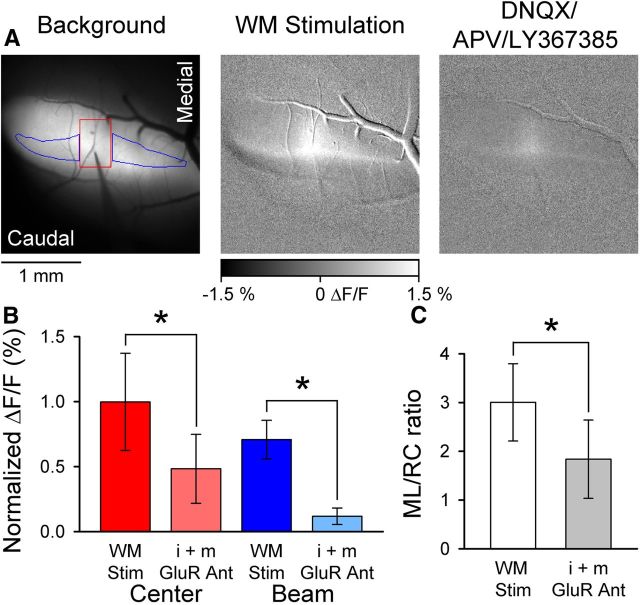
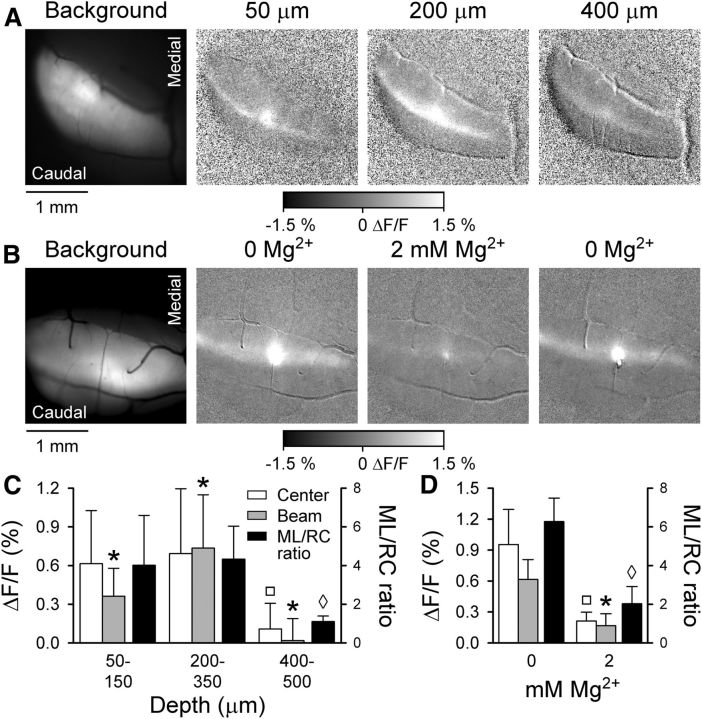
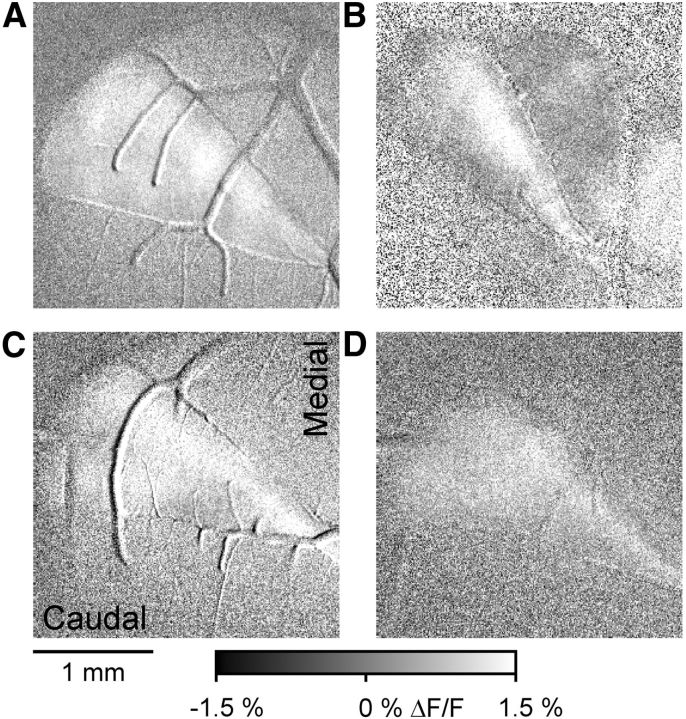
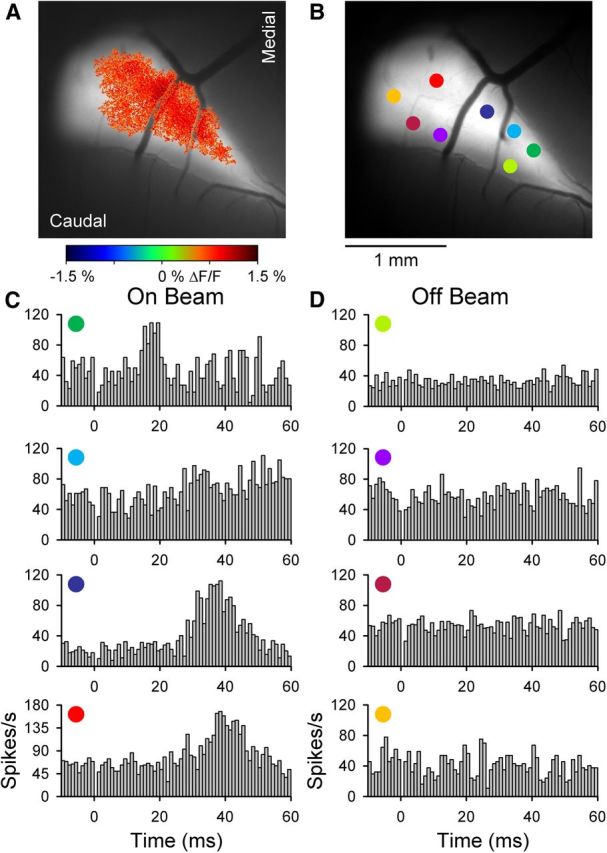
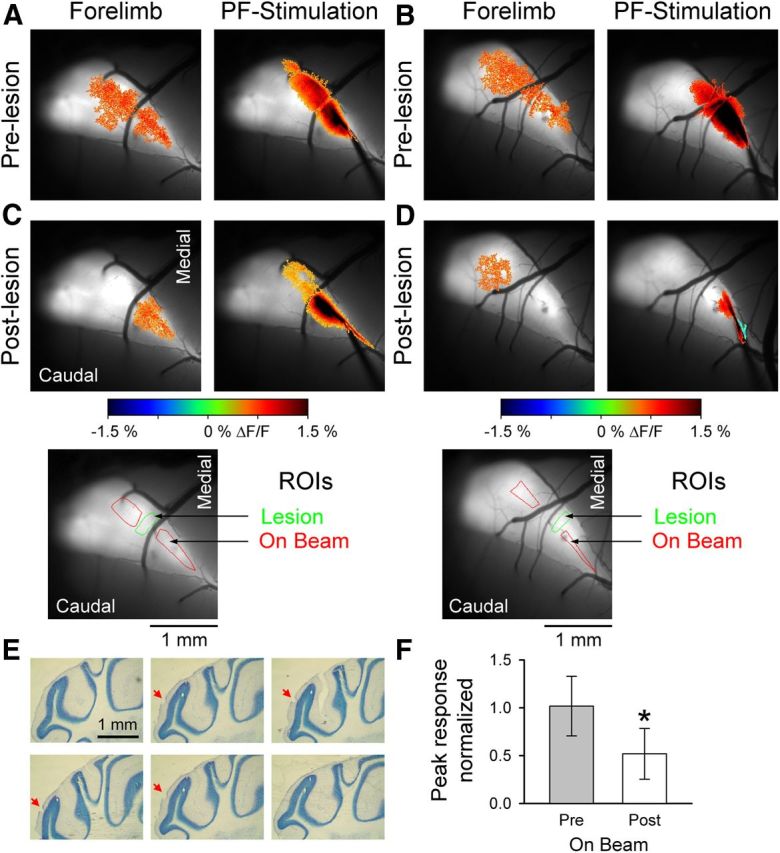
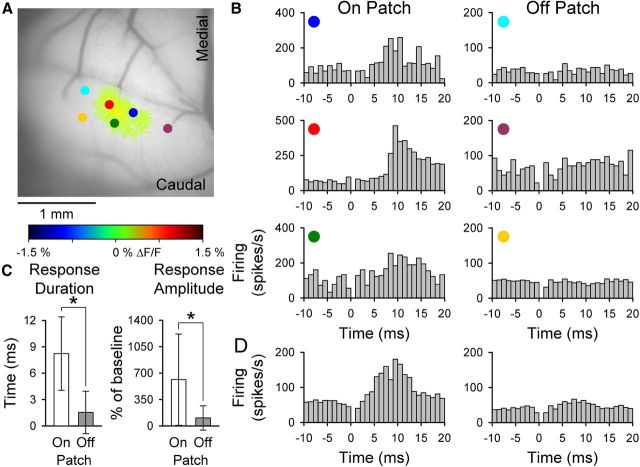
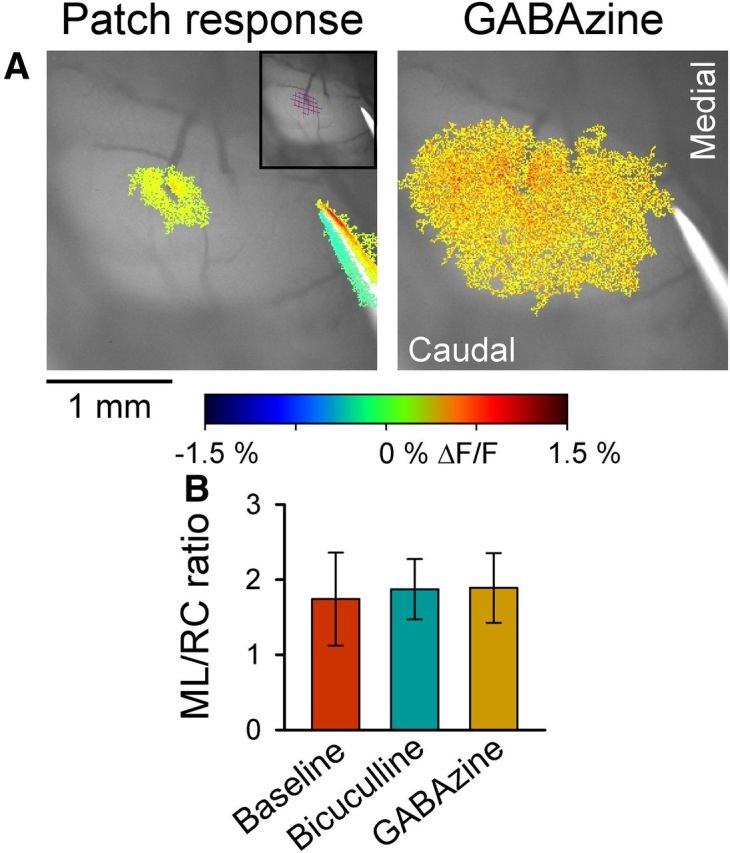
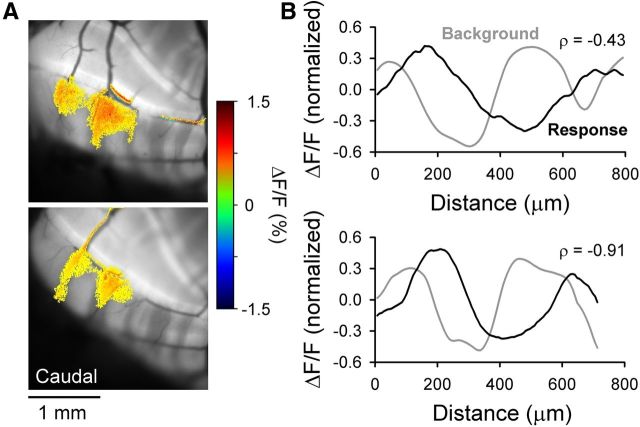
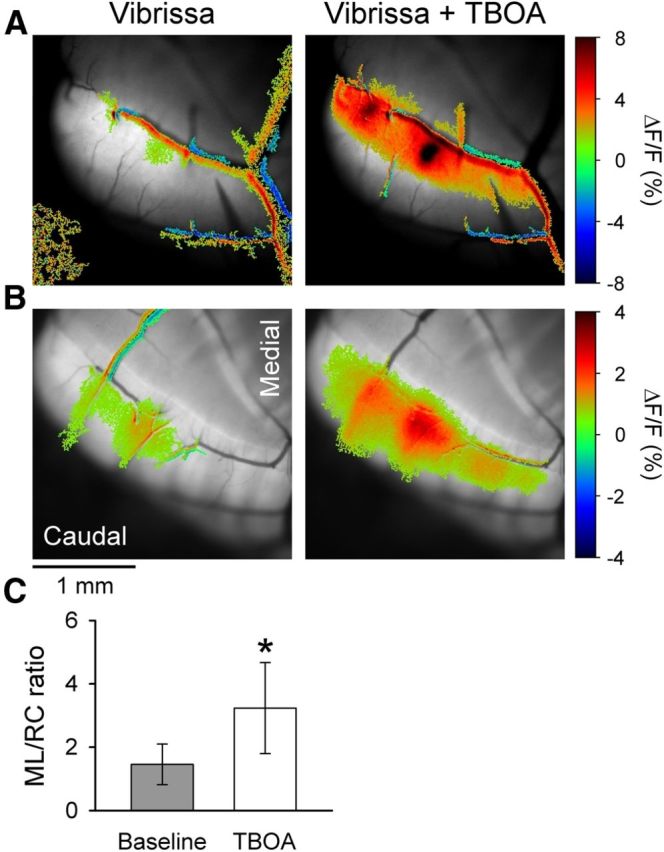
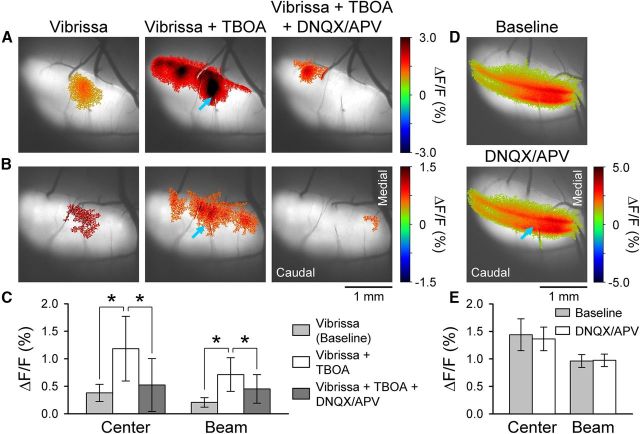
The role of parallel fibers (PFs) in cerebellar physiology remains controversial. Early studies inspired the "beam" hypothesis whereby granule cell (GC) activation results in PF-driven, postsynaptic excitation of beams of Purkinje cells (PCs). However, the "radial" hypothesis postulates that the ascending limb of the GC axon provides the dominant input to PCs and generates patch-like responses. Using optical imaging and single-cell recordings in the mouse cerebellar cortex in vivo, this study reexamines the beam versus radial controversy. Electrical stimulation of mossy fibers (MFs) as well as microinjection of NMDA in the granular layer generates beam-like responses with a centrally located patch-like response. Remarkably, ipsilateral forepaw stimulation evokes a beam-like response in Crus I. Discrete molecular layer lesions demonstrate that PFs contribute to the peripherally generated responses in Crus I. In contrast, vibrissal stimulation induces patch-like activation of Crus II and GABAA antagonists fail to convert this patch-like activity into a beam-like response, implying that molecular layer inhibition does not prevent beam-like responses. However, blocking excitatory amino acid transporters (EAATs) generates beam-like responses in Crus II. These beam-like responses are suppressed by focal inhibition of MF-GC synaptic transmission. Using EAAT4 reporter transgenic mice, we show that peripherally evoked patch-like responses in Crus II are aligned between parasagittal bands of EAAT4. This is the first study to demonstrate beam-like responses in the cerebellar cortex to peripheral, MF, and GC stimulation in vivo. Furthermore, the spatial pattern of the responses depends on extracellular glutamate and its local regulation by EAATs.


Figures

Figure 1.
Figure 1.
WM stimulation evokes beam-like responses. A, Left, Background fluorescence image of Crus II after injection of Oregon Green. Also shown is electrode placement within the folium and ROIs used to quantify the center (red) and beam (blue) components of the fluorescence response. Microelectrode was lowered to a depth of 500 μm below the surface. Middle, The beam-like Ca2+ response to WM stimulation (200 μA, 100 μs pulses at 100 Hz for 100 ms). Right, The beam response is largely blocked by i+mGluR antagonists (100 μm DNQX, 250 μm APV, and 200 μm LY367385). B, Summary data (mean ± SD, n = 4 mice) for the center and beam response components before and after block by GluR antagonists. *p < 0.05. C, Summary ML/RC data for WM stimulation (open bar) and after (filled gray bar) application of i+mGluR antagonists (n = 4 mice).
Figure 2.
Figure 2.
Granular layer stimulation by NMDA evokes beam-like response. A, Cerebellar activation evoked by NMDA/glycine microinjection. Left, Background fluorescence of Crus II followed by a series of grayscale images to the right showing typical Ca2+ responses to NMDA/glycine microinjections at 50, 200, and 400 μm below the cerebellar surface. Peak beam-like activity is evoked when NMDA/glycine is microinjected at 200–350 μm below the cortical surface, depths corresponding to the granular layer. B, To verify that the responses were NMDA receptor-mediated, NMDA injections were performed at a depth evoking a maximal response in the 0 mm Mg2+ Ringer's solution and repeated upon reintroduction of 2 mm Mg2+ into the optical chamber bath. C, Fluorescence responses (ΔF/F on left axis) are summarized for the center and beam components (Fig. 1A, ROI example) as well as the ML/RC ratios (right axis) for NMDA/glycine injection within three depth ranges below the cerebellar surface (n = 9 mice). The *, □, ◊ values are significantly different from all other values in the same group (i.e., control, beam, ML/RC). The ◊ indicates the ML/RC ratio for injection at 400–500 μm is significantly different from the ML/RC ratio for injections at either 50–150 or 200–130 μm. D, Summary fluorescence responses and ML/RC ratios for NMDA/glycine injections with and without Mg2+. The *, □, ◊ values are significantly different from all other values in the same group (i.e., control, beam, ML/RC). The ◊ indicates the ML/RC ratio for injection at 400–500 μm is significantly different from the ML/RC ratio for injections at either 50–150 or 200–130 μm.
Figure 3.
Figure 3.
Ipsilateral forelimb stimulation evokes beam-like responses in Crus I. A–D, Four examples of the beam-like Ca2+ responses evoked by bipolar electrical stimulation applied to the ipsilateral forepaw (10–20 V, 300 μs pulses at 100 Hz for 50–100 ms). Each example is from a different mouse. The Ca2+ images are shown as ΔF/F obtained by subtraction of averaged baseline images from images obtained during the stimulus (see Materials and Methods) and displayed with grayscale.
Figure 4.
Figure 4.
On and off beam PC simple spike responses in Crus I. A, Example of the Ca2+ response defined by statistical thresholding (see Materials and Methods) evoked by ipsilateral forepaw stimulation overlaid on an image of the background fluorescence. B, Recording locations for PCs recorded within (On Beam) or outside (Off Beam) of the forelimb-evoked response region in A. C, D, Simple spike firing histograms corresponding to the PCs shown in B. Histograms were constructed from 100 to 200 trials of 300 μs, 20 V pulses. Stimulus onset at t = 0 and 0 ms bin is blank because of the stimulus artifact.
Figure 5.
Figure 5.
PFs contribute to the beam-like response in Crus I. A, B, Example images from two mice showing the fluorescence responses evoked by forelimb stimulation (left) or direct PF stimulation (right). C, D, After electrolytic lesioning of the molecular layer (inset below, green ROIs), the peripherally evoked beam-like response (left) is reduced. Also, the response to direct PF stimulation is disrupted (right). Bottom images, The R0Is used to quantify the On Beam response (red) and the location of the lesion (green). E, Consecutive 40 μm sections showing the lesion location and depth in the molecular layer (red arrow). F, Normalized On Beam response to forelimb stimulation is significantly reduced after PF lesioning (n = 7 mice). *p < 0.05.
Figure 6.
Figure 6.
Spatial relation between flavoprotein and PC simple spike responses to peripheral stimulation in Crus II. A, Ipsilateral vibrissal pad stimulation evokes patch-like increase in fluorescence that was defined by the statistical thresholding. Also shown are the recording locations (colored circles) of PCs relative to the optical response (On Patch vs Off Patch). B, Simple spike histograms for the On Patch (left) and Off Patch (right) PCs shown in A. Each histogram was generated from 100 vibrissal stimuli. Other conventions as in Figure 4. C, Duration and amplitude (mean ± SD) of the significant simple spike modulation for the population of 80 PCs recorded within and outside of the response region (n = 8 animals). D, Population histograms of simple spike firing for the 80 PCs recorded On Patch (left) and Off Patch (right) of the statistically defined optical response.
Figure 7.
Figure 7.
Blocking molecular layer inhibition does not result in beam-like responses. A, Left, The patch-like response in Crus II to stimulation of the ipsilateral vibrissal pad. Top right inset, Thresholded response region covered by grid used to measure the RC and ML extent of the response. Statistical thresholded flavoprotein response is superimposed on the background fluorescence. Right, Application of GABAzine (SR-95531, 200 μm) increases the amplitude and area of the response but does not result in beam-like activation. Also shown in both images is the PF-stimulating electrode used in all experiments to test the integrity of the cerebellar cortex. B, Summary data of the ratio of the extent of the response in the ML and RC directions before (baseline) and after application of the GABAA antagonists, 200 μm GABAzine or 100 μm bicuculline (n = 9 mice).
Figure 8.
Figure 8.
Spatial correspondence between EAAT4 expression in PCs and the response to peripheral input in Crus II. A, Example images of the patch-like Ca2+ responses in Crus II evoked by stimulation of the ipsilateral vibrissae using the EAAT4 reporter mouse that expresses GFP under the control of the EAAT4 promoter. The responses align with parasagittal regions expressing lower levels of the EAAT4 transporter. B, Evoked Ca2+ fluorescence responses (black trace) and background EAAT4 fluorescence in the same folium (gray trace) corresponding to the images in A. Correlation coefficient (ρ) between the background fluorescence and the evoked response is shown.
Figure 9.
Figure 9.
Blocking EAATs converts the patch-like response in Crus II to a beam-like response. A, Statistically thresholded image of the Ca2+ response in Crus II to ipsilateral vibrissal stimulation (10–20 V, 300 μs pulses at 100 Hz for 50–100 ms) before (Vibrissa) and upon bath application of 300 μm TBOA in an FVB mouse (Vibrissa + TBOA). There is increased fluorescence response on or surrounding several blood vessels. This reflects the increased blood flow that accompanies activation of the cerebellar cortex (Mathiesen et al., 1998; Yang et al., 1999). Blood vessel-related activation was commonly observed. B, Same experiment as in A in an EAAT4 reporter mouse. C, Ratio of ML to RC dimensions of the evoked responses in the baseline condition (gray) and in the presence of TBOA (white) based on 10 FVB and 2 EAAT4 mice. *p < 0.05.
Figure 10.
Figure 10.
Microinjection of glutamate receptor antagonists into the granular layer disrupts beam-like response in Crus II. A, B, Statistically thresholded images from two mice of the Ca2+ response evoked by ipsilateral vibrissal pad stimulation (Vibrissa), with bath application of 300 μm TBOA (Vibrissa + TBOA), and with microinjection of iGluR antagonists (100 μm DNQX and 250 μm APV, 5.95 ± 2.37 nl) into the granular layer (depth of ∼250 μm). Middle, Blue arrow indicates the injection site. In both examples, focal injection of iGluR antagonists into the granular layer reduces the beam-like response in the presence of TBOA. The PF-stimulating electrode is evident in the experiment shown in A. Also, blood vessel-related increases in fluorescence are present in both A and B (Fig. 9). C, Summary data (n = 6 mice) for the center and beam response components for the baseline with TBOA alone and TBOA with microinjection of GluR antagonists. *p < 0.05. D, Statistically thresholded images of the Ca2+ response in Crus II evoked by direct PF stimulation with two electrodes before (Baseline) and after microinjection of iGluR antagonists (DNQX/APV) at a depth of 250 μm (blue arrow). E, Summary data (n = 3 mice) for the center and beam responses for the baseline and DNQX/APV injection.

Similar articles

Cited by

References

    1. Apps R, Hawkes R. Cerebellar cortical organization: a one-map hypothesis. Nat Rev Neurosci. 2009;10:670–681. doi: 10.1038/nrn2698. - DOI - PubMed
    1. Bao J, Reim K, Sakaba T. Target-dependent feedforward inhibition mediated by short-term synaptic plasticity in the cerebellum. J Neurosci. 2010;30:8171–8179. doi: 10.1523/JNEUROSCI.0276-10.2010. - DOI - PMC - PubMed
    1. Bell CC, Grimm RJ. Discharge properties of Purkinje cells recorded on single and double microelectrodes. J Neurophysiol. 1969;32:1044–1055. - PubMed
    1. Bilak SR, Bilak MM, Morest DK. NMDA receptor expression in the mouse cerebellar cortex. Synapse. 1995;20:257–268. doi: 10.1002/syn.890200310. - DOI - PubMed
    1. Bosman LW, Koekkoek SK, Shapiro J, Rijken BF, Zandstra F, van der Ende B, Owens CB, Potters JW, de Gruijl JR, Ruigrok TJ, De Zeeuw CI. Encoding of whisker input by cerebellar Purkinje cells. J Physiol. 2010;588:3757–3783. doi: 10.1113/jphysiol.2010.195180. - DOI - PMC - PubMed

Publication types

Substances

LinkOut - more resources