. 2013 Jul 10;33(28):11451-63.
doi: 10.1523/JNEUROSCI.5637-12.2013.

Distinctive changes in plasma membrane phosphoinositides underlie differential regulation of TRPV1 in nociceptive neurons

Affiliations

Distinctive changes in plasma membrane phosphoinositides underlie differential regulation of TRPV1 in nociceptive neurons

Viktor Lukacs et al. J Neurosci. .

Abstract

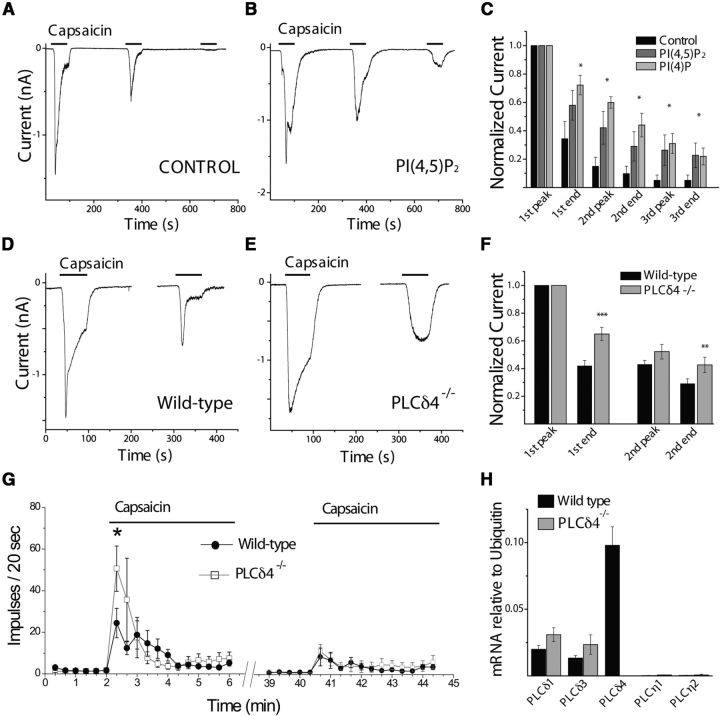
Transient Receptor Potential Vanilloid 1 (TRPV1) is a polymodal, Ca(2+)-permeable cation channel crucial to regulation of nociceptor responsiveness. Sensitization of TRPV1 by G-protein coupled receptor (GPCR) agonists to its endogenous activators, such as low pH and noxious heat, is a key factor in hyperalgesia during tissue injury as well as pathological pain syndromes. Conversely, chronic pharmacological activation of TRPV1 by capsaicin leads to calcium influx-induced adaptation of the channel. Paradoxically, both conditions entail activation of phospholipase C (PLC) enzymes, which hydrolyze phosphoinositides. We found that in sensory neurons PLCβ activation by bradykinin led to a moderate decrease in phosphatidylinositol-4,5-bisphosphate (PI(4,5)P2), but no sustained change in the levels of its precursor PI(4)P. Preventing this selective decrease in PI(4,5)P2 inhibited TRPV1 sensitization, while selectively decreasing PI(4,5)P2 independently of PLC potentiated the sensitizing effect of protein kinase C (PKC) on the channel, thereby inducing increased TRPV1 responsiveness. Maximal pharmacological TRPV1 stimulation led to a robust decrease of both PI(4,5)P2 and its precursor PI(4)P in sensory neurons. Attenuating the decrease of either lipid significantly reduced desensitization, and simultaneous reduction of PI(4,5)P2 and PI(4)P independently of PLC inhibited TRPV1. We found that, on the mRNA level, the dominant highly Ca(2+)-sensitive PLC isoform in dorsal root ganglia is PLCδ4. Capsaicin-induced desensitization of TRPV1 currents was significantly reduced, whereas capsaicin-induced nerve impulses in the skin-nerve preparation increased in mice lacking this isoform. We propose a comprehensive model in which differential changes in phosphoinositide levels mediated by distinct PLC isoforms result in opposing changes in TRPV1 activity.


Figures

Figure 1.
Figure 1.
Capsaicin induces depletion of PI(4)P and PI(4,5)P2 in nociceptors. A, Confocal images of DRG neurons transfected with the YFP-tagged R322H Tubby domain (top, pseudo-colored yellow) or the GFP-tagged Osh2 tandem-PH domain (bottom, pseudo-colored green) as reporters of plasma membrane phosphoinositides. Images are representatives of reporter distribution before and after the application of 1 μm capsaicin (Caps). Scale bars, 10 μm. B, Magnified images of Tubby (top) and Osh2 (bottom) reporter localization before and after capsaicin application at the neurites (left) and varicosities (right) distant from the cell body indicated in A by arrowheads pointing at the regions magnified. The graph under each pair of magnified images corresponds to fluorescence intensities (in arbitrary fluorescence units [AFU]) plotted along the lines indicated in each image. C, Time course of membrane to cytoplasm fluorescence ratio changes for Tubby and Osh2 reporters in response to treatments with 1 μm capsaicin. Images were taken at 8 s intervals; data points represent mean ± SEM of normalized membrane to cytoplasm fluorescence ratios at the cell body (n = 4 or 5 neurons per group). D, Time course of membrane to cytoplasm ratio changes for Tubby and Osh2 in response to 1 nm resiniferatoxin (RTX) conducted identically to that described in C. Slow translocation of the fluorescent probes in a subset of neurons (RTX positive) is appreciable compared with neurons that displayed no response to RTX (RTX negative). Data points represent mean ± SEM of n = 4–6 neurons per group. All measurements were conducted in standard NCF solution supplemented with 1.25 mm CaCl2 (see Materials and Methods).
Figure 2.
Figure 2.
Breakdown of phosphoinositides is mediated by Ca2+ entry via TRPV1. A, Confocal images in isolated DRG neurons expressing the YFP-tubby domain. Each of the three images represents a selected time point indicated by numbers 1–3 from the time series measurement shown in B. Ca2+ in the extracellular medium was initially chelated by adding 0.5 mm EGTA to the standard NCF solution, Ca2+ was then elevated to a 1.25 mm final concentration in the presence of 1 μm capsaicin (n = 5 or 6 neurons per group), *p < 0.05. ***p < 0.005. C, Representative images at time points indicated in D of neurons expressing either YFP-Tubby (top) or GFP-Osh2 (bottom) probes. Neurons were first depolarized with an isotonic solution containing 25 or 30 mm KCl and subsequently exposed to 1 μm capsaicin (Caps). Results from 25 and 30 mm KCl treatment were similar and were thus pooled for representation. Chelating extracellular Ca2+ with 3 mm EGTA induced partial relocalization of both probes to the plasma membrane. Data points represent mean ± SEM of normalized fluorescence ratios of 7–10 TRPV1-positive cells. E, Representative mean ± SEM normalized fluorescence ratios (340 nm/380 nm) from DRG neurons loaded with the ratiometric Ca2+ indicator fura-2 stimulated with either 30 mm KCl or 1 μm capsaicin (one coverslip each). F, Representative fluorescence ratio changes (340 nm/380 nm) from DRG neurons loaded with the low-affinity ratiometric Ca2+ indicator fura-2 FF. Experiments were conducted similarly to E; representative traces show measurements from one coverslip each. G, Bar graph represents statistics of n = 17 or 18 capsaicin-positive cells from 3 coverslips in each group for fura-2 FF and n = 39–43 cells from 3 or 4 coverslips in each group for fura-2. Peak ratio changes are displayed as mean ± SEM. **p < 0.01.
Figure 3.
Figure 3.
Inhibiting PI(4)P or PI(4,5)P2 depletion reduces TRPV1 desensitization in neurons. A, B, Representative whole-cell voltage-clamp traces of inward currents recorded at −60 mV from isolated DRG neurons. Measurements were conducted in standard NCF solution supplemented with 1.25 mm CaCl2. Before each measurement, a waiting period of 2–3 min was used in the whole-cell setting to allow for diffusion of the pipette solutions, which were based on NIC-DRG (see Materials and Methods) and supplemented as follows: control, no lipid supplement (A), 100 μm diC8-PI(4,5)P2 (B), and 100 μm diC8-PI(4)P (representative trace not shown). C, Statistical analysis of n = 6–8 neurons in each group (control, diC8--PI(4,5)P2 and DiC8-PI(4)P, respectively) displayed as mean ± SEM. Current values were normalized to the peak of the first current response and measured subsequently at the peak and end of each capsaicin pulse. There were no statistically significant differences in the raw current densities between the three groups (ANOVA: 124 ± 26 pA/pF for control, 94 ± 29 pA/pF for PI(4,5)P2, and 81 ± 30 pA/pF for PI(4)P groups, respectively). *p < 0.05. D–F, Perforated patch-clamp experiments on DRG neurons. Representative traces of PLCδ4−/− (E) and wild-type littermate controls (D). To ensure fidelity of the measurements of large currents evoked by 1 μm capsaicin recordings were interrupted between stimulus pulses to check for stability of low access resistance of the perforated patch (see Materials and Methods). F, Statistical analysis of current amplitudes normalized to the first peak. Bars represent mean ± SEM of n = 15 PLCδ4−/− and n = 22 wild-type control measurements. There was no significant difference between the raw current densities recorded from neurons of knock-out and control animals. **p < 0.01. ***p < 0.005. G, Extracellular single-fiber recordings in the skin–nerve preparation were performed as described in Materials and Methods. After a 2 min control recording, the receptive field was stimulated for 4 min with 10 μm capsaicin, followed by a 30 min wash period, then a second 4 min application of 10 μm capsaicin. Nerve impulses were divided into 20 s bins and plotted; n = 29 for PLCδ4−/− and n = 32 for wild-type littermates. H, Real-time PCR analysis of highly calcium-sensitive PLC isoform expression in crude DRG mRNA extracts of wild-type or PLCδ4 KO mice. Bars represent mean ± SEM of relative mRNA quantities, calculated from five separate isolations (control) or two separate isolations (KO) as normalized to ubiquitin-a mRNA levels.
Figure 4.
Figure 4.
Bradykinin decreases PI(4,5)P2, but not PI(4)P, levels in DRG neurons. A, Representative images of isolated DRG neurons transfected either with the YFP-tagged R332H Tubby domain (top) or the GFP-tagged Osh2-tandem-PH domain construct (bottom). Images in each of the three columns represent time points in B indicated by 1–3. B, Mean ± SEM of normalized membrane to cytoplasm fluorescence ratios recorded from n = 7–10 neurons. The measurements were conducted in standard NCF solution supplemented with 1.25 mm CaCl2. Scale bars, 10 μm.
Figure 5.
Figure 5.
Intracellular dialysis of PI(4,5)P2, but not PI(4)P, inhibits sensitization of capsaicin-induced currents by bradykinin in DRG neurons. A–C, Whole-cell current recordings from isolated DRG neurons clamped at −60 mV in standard NCF solution supplemented with 1.25 mm Ca2+, demonstrating the effect of dialysis of intracellular solutions based on NIC-DRG and supplemented as follows: A, Control, no supplement (n = 12); B, 100 μm diC8-PI(4,5)P2 (n = 10); C, 100 μm diC8-PI(4)P (n = 10). D, Summary represented as mean ± SEM of fold increase in current as calculated by the ratio of 100 nm capsaicin responses immediately before and after the 1 min application of bradykinin. *p < 0.05, **p < 0.01. Statistical analysis was performed with the Student's t test. There were no statistically significant differences between raw current densities in the three groups.
Figure 6.
Figure 6.
Intracellular dialysis of PI(4,5)P2 inhibits sensitization of low pH-induced TRPV1 currents. Whole-cell current recordings at −60 mV from HEK293 cells coexpressing TRPV1 and the bradykinin B2 receptor. The bath solution was standard NCF supplemented with 5 mm EGTA to prevent desensitization. Traces representative of the effects of intracellular diffusion of standard NIC solution supplemented with the following: A, control, no substitution (n = 14); B, 100 μm diC8-PI(4,5)P2 (n = 15); C, 2 μm 19–31 amide PKC inhibitor peptide (n = 11). D, Summary of results obtained by stimulation of TRPV1 with low extracellular pH (left) or 20 nm capsaicin (right; n = 11 control and n = 8 PI(4,5)P2). Sensitization was calculated as the ratio of current amplitudes evoked by low pH or capsaicin pulses immediately before and after bradykinin application. Bars represent mean ± SEM for each group. *p < 0.05 (Mann–Whitney U test). There were no statistically significant differences in initial raw current amplitudes between the various groups.
Figure 7.
Figure 7.
Selective conversion of PI(4,5)P2 to PI(4)P has no effect on TRPV1 currents. A, B, Representative whole-cell voltage-clamp traces from HEK293 cells transiently cotransfected with TRPV1, Kir2.1, and either the wild-type (wt) or the catalytically inactive voltage-sensitive phosphatase from zebrafish (Dr-VSP). Standard NCF solution was supplemented with 5 mm EGTA to prevent desensitization of the channel. Intracellular solution was Cs-IC (see Materials and Methods). TRPV1 currents were activated by low pH, whereas inward potassium currents through Kir2.1 were initiated by elevating the extracellular potassium concentration to 100 mm (high K+, osmolarity maintained) while maintaining a holding potential of −60 mV. Successive depolarizing steps of 0.3, 1, and 3 s to +100 mV were used to activate the VSP. This was repeated both while measuring TRPV1 and Kir2.1 currents. C, D, Summary statistics of the effect of VSP activation on TRPV1 (C) and Kir2.1 (D) currents. Statistics shown represent n = 6 cells in the VSP-inactive group and n = 11 in the VSP-wt group. Data are mean ± SEM are shown.
Figure 8.
Figure 8.
Simultaneous PI(4)P and PI(4,5)P2 decrease inhibits TRPV1. HEK293 cells coexpressing TRPV1 and either the rapamycin-inducible dual 4′ and 5′ phosphatase system Pseudojanin (PJ) or its catalytically inactive negative control pair (PJ-inactive) were voltage-clamped in the whole-cell configuration in standard NCF containing 5 mm EGTA added to prevent Ca2+-induced desensitization. Intracellular solution was NIC. A, B, Representative traces of inward TRPV1 currents at −60 mV demonstrating the protocol applied. C, Magnification of the pH 6.0 responses from the representative traces from A and B. D, Summary (mean ± SEM) of the effect of selective decrease of both PI(4)P and PI(4,5)P2 1 min after the start of 500 nm rapamycin perfusion. Fold changes were normalized to stable current values observed immediately before rapamycin application (n = 6 or 7). *p < 0.05, ***p < 0.005. E, Two-electrode voltage-clamp recording from Xenopus laevis oocytes heterologously expressing TRPV1 channels (see Materials and Methods). The effect of a 90 min pretreatment with either 35 μm or 35 nm wortmannin on current responses to the indicated pH challenges are shown normalized to the average values observed in the control (DMSO-treated) group. Data are plotted as mean ± SEM of n = 21 in the control group and 26 in both the 35 μm and 35 nm wortmannin-treated groups. *p < 0.05, **p < 0.01, ***p < 0.005.
Figure 9.
Figure 9.
Selective conversion of PI(4,5)P2 to PI(4)P synergizes with PKC-mediated, but not with PKA-mediated, phosphorylation to sensitize TRPV1. A–C, Representative whole-cell current traces in HEK293 cells at −60 mV coexpressing TRPV1, Kir2.1, and either a catalytically active (wt) or inactive Dr-VSP. Currents were measured in standard NCF solution supplemented with 5 mm EGTA to prevent Ca2+-induced desensitization. After establishment of baseline TRPV1 currents, successive 3 s depolarizing pulses to +100 mV were applied to elicit maximal conversion of PI(4,5)P2 to PI(4)P. This was performed in the presence of 100 mm extracellular K+ (High K+) to assess the effect of PI(4,5)P2 depletion on Kir2.1 channels. Then, after a final control pH 6.0 pulse, the PKC activator OAG was applied at either 1 or 10 μm concentration, and the effects were assessed on pH 6.0-elicited TRPV1 responses. The intracellular solutions were based on Cs-IC (see Materials and Methods) and complemented as follows: A, B, no addition; C, 19–31 amide PKC inhibitor peptide (2 μm). D, Summary of findings as represented by mean ± SEM of 5 or 6 traces in each group. Fold potentiation was calculated by dividing the amplitude of the second low pH pulse after OAG with that preceding the application of OAG. This value was 0.965 ± 0.12 for the inactive VSP with 1 μm OAG. *p < 0.05 (Student's t test). E, F, Representative whole-cell current traces in HEK293 cells at −60 mV coexpressing TRPV1, Kir2.1, and either the wild-type or inactive Dr-VSP. PKA was activated by the cell-permeable 8-Br-cAMP (20 μm), and its effect on n = 8 cells in both groups was quantified as the ratio of TRPV1 current responses before and after PKA activation. TRPV1 sensitization was 1.57 ± 0.315-fold and 1.504 ± 0.309-fold in the VSP-inactive and VSP-wt groups, respectively. Insets, The last 3 pH pulses on an enlarged scale.
Figure 10.
Figure 10.
Model for the role of PLC activation in sensitization and desensitization of TRPV1. A, During maximal pharmacological activation of TRPV1, robust calcium influx activates highly calcium-sensitive PLCδ isoform(s), leading to substantial decrease of both PI(4,5)P2 and PI(4)P levels. This results in desensitization because channel activity generally depends on the presence of these lipids. The loss of phospholipids and the resultant decrease of TRPV1 activity dominate over the effect of a potential concomitant PKC activation. B, During bradykinin-mediated sensitization, a selective decrease in PI(4,5)P2, but not PI(4)P, allows for maintained TRPV1 activity, whereas the decreased PI(4,5)P2 levels synergize with the sensitizing effect of PKC phosphorylation, resulting in TRPV1 current potentiation.

Similar articles

Cited by

References

    1. Balla A, Kim YJ, Varnai P, Szentpetery Z, Knight Z, Shokat KM, Balla T. Maintenance of hormone-sensitive phosphoinositide pools in the plasma membrane requires phosphatidylinositol 4-kinase IIIalpha. Mol Biol Cell. 2008;19:711–721. doi: 10.1091/mbc.E07-07-0713. - DOI - PMC - PubMed
    1. Balla T. Pharmacology of phosphoinositides, regulators of multiple cellular functions. Curr Pharm Des. 2001;7:475–507. doi: 10.2174/1381612013397906. - DOI - PubMed
    1. Bhave G, Hu HJ, Glauner KS, Zhu W, Wang H, Brasier DJ, Oxford GS, Gereau RW., 4th Protein kinase C phosphorylation sensitizes but does not activate the capsaicin receptor transient receptor potential vanilloid 1 (TRPV1) Proc Natl Acad Sci U S A. 2003;100:12480–12485. doi: 10.1073/pnas.2032100100. - DOI - PMC - PubMed
    1. Cao E, Cordero-Morales JF, Liu B, Qin F, Julius D. TRPV1 channels are intrinsically heat sensitive and negatively regulated by phosphoinositide lipids. Neuron. 2013;77:667–679. doi: 10.1016/j.neuron.2012.12.016. - DOI - PMC - PubMed
    1. Caterina MJ, Schumacher MA, Tominaga M, Rosen TA, Levine JD, Julius D. The capsaicin receptor: a heat-activated ion channel in the pain pathway. Nature. 1997;389:816–824. doi: 10.1038/39807. - DOI - PubMed

Publication types

MeSH terms