. 2013 Jul 10;33(28):11556-72.
doi: 10.1523/JNEUROSCI.0535-13.2013.

Evidence for a gender-specific protective role of innate immune receptors in a model of perinatal brain injury

Affiliations

Evidence for a gender-specific protective role of innate immune receptors in a model of perinatal brain injury

Pedro M Pimentel-Coelho et al. J Neurosci. .

Abstract

Hypoxia-ischemia is a common cause of neurological impairments in newborns, but little is known about how neuroinflammation contributes to the long-term outcome after a perinatal brain injury. In this study, we investigated the role of the fractalkine receptor chemokine CX3C motif receptor 1 (CX3CR1) and of toll-like receptor (TLR) signaling after a neonatal hypoxic-ischemic brain injury. Mice deficient in the TLR adaptor proteins Toll/interleukin-1 receptor-domain-containing adaptor protein inducing interferon β (TRIF) or myeloid differentiation factor-88 (MyD88) and CX3CR1 knock-out (KO) mice were subjected to hypoxia-ischemia at postnatal day 3. In situ hybridization was used to evaluate the expression of TLRs during brain development and after hypoxic-ischemic insults. Behavioral deficits, hippocampal damage, reactive microgliosis, and subplate injury were compared among the groups. Although MyD88 KO mice exhibited no differences from wild-type animals in long-term structural and functional outcomes, TRIF KO mice presented a worse outcome, as evidenced by increased hippocampal CA3 atrophy in males and by the development of learning and motor deficits in females. CX3CR1-deficient female mice showed a marked increase in brain damage and long-lasting learning deficits, whereas CX3CR1 KO male animals did not exhibit more brain injury than wild-type mice. These data reveal a novel, gender-specific protective role of TRIF and CX3CR1 signaling in a mouse model of neonatal hypoxic-ischemic brain injury. These findings suggest that future studies seeking immunomodulatory therapies for preterm infants should consider gender as a critical variable and should be cautious not to abrogate the protective role of neuroinflammation.


Figures

Figure 1.
Figure 1.
TLR mRNA expression is developmentally regulated in the mouse telencephalon. A–D, Dark-field photomicrographs showing the expression of TLR2 mRNA in coronal brain sections of embryonic and early postnatal mouse telencephalon. TLR2 expression can be observed in the choroid plexus at E18 (arrowhead in A), P7 (arrowhead in B), and P14 (arrow in D). At E18, TLR2 mRNA expression could also be observed in the subcallosal region at the midline (arrow in A). At P7, TLR2 mRNA was present in the white matter and in the region immediately below the external capsule (arrows in B), as well as in the callosal/subcallosal regions ranging from the dorsolateral aspect of the lateral ventricles to the midline (arrows in C). E–H, TLR3 mRNA expression was detected throughout the cerebral cortex and hippocampus at E18 (E), P7 (F), P14 (G), and P22 (H). I–L, TLR6 expression was mainly detected in the subcallosal region at the midline at E18 ((arrow in I), in the white matter and in the region immediately below the external capsule at P3 (arrows in J), and in the dorsal aspect of the lateral ventricles at P7 (arrow in K), but no expression was detected at P22 (L). M–Q, TLR7 expression was already observed in the hippocampus and in a few scattered cells in the cortical plate at E14 (arrows in M). TLR7 mRNA was also detected in the subcallosal region at the midline at E18 (arrow in N), in the white matter and in the region immediately below the external capsule at P3 (arrows in O) and in the callosal/subcallosal regions from the dorsolateral aspect of the lateral ventricles to the midline at P7 (arrows in P), but could not be detected at P22 (Q). R–T, TLR9 mRNA distribution was similar to TLR6 and TLR7 expression at E18 (arrow in R) and P3 (arrow in S). TLR9 expression was still observed throughout the cortex and hippocampus at P14 (T). Cc, Corpus callosum; cg, cingulum; cpl, cortical plate; cx, cerebral cortex; dg, dentate gyrus; hp, hippocampus; lv, lateral ventricle. Scale bars: A, K, M, N, 200 μm; B–D, E–H, J, L, O–T, 500 μm; I, 1 mm.
Figure 2.
Figure 2.
Spatiotemporal pattern of microglial activation in the developing brain. A, Quantification of TLR2, TLR3, TLR6, TLR7, and TLR9 mRNA expression in the brains of P3 and P7 WT male and female mice by qRT-PCR. Results were normalized to 18S expression and are expressed as mean ± SEM (*p < 0,05, Kruskal–Wallis test with Dunn's multiple-comparisons test). B, G, L, Q, V, Representative photomicrographs of glial fibrillary acidic protein-immunostained coronal brain sections showing the presence of astrocytes in the subcallosal region in the midline at E18 (arrow in B), in the dorsal periventricular region at P7 and P22 (arrows in G,L), and in the white matter below the apex of the cingulum at P7 and P22 (arrows in Q and V). Slices were counterstained with thionin. C, H, M, R, W, Representative photomicrographs of Iba1-immunostained coronal brain sections showing the presence of amoeboid microglial cells at E18 (arrow in C) and P7 (arrows in H and R), but not at P22 (arrows in M,W). Slices were counterstained with thionin. D–F, I–K, N–P, S–U, X–Z, Confocal photomicrographs demonstrating the expression of the activation marker CD68 (in red) in Iba1+ microglia (in green) in the subcallosal region in the midline at E18 (D–F), in the dorsal periventricular region at P7 (in I–K) and at P14 (in N–P) and in the white matter below the apex of the cingulum at P7 (in S–U) and at P14 (in X–Z). Nuclear staining with DAPI is shown in blue. Cc, Corpus callosum; hp, hippocampus; lv, lateral ventricle. Scale bars: B, C, G, H, L, M, Q, R, V, W, 200 μm; D–F, I–K, N–P, S–U, X–Z, 40 μm.
Figure 3.
Figure 3.
Neonatal hypoxic–ischemic brain injury in P3 mice. A–D, Representative photomicrographs of Fluoro-Jade B staining in coronal brain slices 24 h after hypoxia–ischemia. A, Photomontage showing the pattern of neurodegeneration in the hippocampus (arrowhead) and cerebral cortex (arrows) of the ipsilateral hemisphere. B–D, Higher-magnification images showing Fluro-Jade B-stained degenerating neurons in the ipsilateral hippocampus (B) and cerebral cortex (D). Note the absence of Fluoro-Jade B staining in the contralateral hippocampus (C). E–F, Representative photomicrographs of Fluoro-Jade B staining in HI WT male mice (E) and HI WT female mice (F) 3 d after the injury. G, WT male pups showed significantly more degenerating neurons in the hippocampal CA3 region compared with WT female mice 3 d after the injury (*p < 0.05, Mann–Whitney test). H, HI WT male and HI WT female mice showed similar decreases in the area of fractalkine mRNA expression in the CA1/2 and CA3 hippocampal regions 3 d after the injury. I–N, Dark-field photomicrographs showing the strong downregulation of fractalkine mRNA expression in the damaged regions of the ipsilateral hippocampus (arrows in I, K, M, N) compared with the contralateral hippocampus (J, L) 24 h (I, J), 3 d (K, L), and 5 weeks (M, N) after the injury. O, P, Bright-field photomicrographs showing glial fibrillary acidic protein-positive astrocytes (O) and ionized calcium binding adaptor molecule-1-positive microglia (P) in the ipsilateral hippocampus of HI WT mice 5 weeks after the injury. Slices were counterstained with thionin. The arrow points to the glial scar in the ipsilateral CA3 region, which was composed mainly of GFAP-positive astrocytes. Q, Quantification of TLR2, TLR3, TLR6, TLR7, and TLR9 mRNA expression in the brain of HI WT male and HI WT female mice 3 d after the injury by qRT-PCR. Results were normalized to Hprt1 expression. Dg, Dentate gyrus; pf, pyriform cortex. Results are expressed as mean ± SEM. Scale bars: A, 400 μm; B–F, I, J, M–P, 200 μm; K, L, 500 μm.
Figure 4.
Figure 4.
Neonatal hypoxia–ischemia induces the expression of TLR mRNA in the brain. A–W, Representative dark-field photomicrographs showing the expression of TLR2 (A–G), TLR6 (H–K), TLR7 (L–Q), and TLR9 (R–W) mRNA in coronal brain sections at several time points after neonatal hypoxia–ischemia. Arrows point to regions with an increased expression of a given TLR mRNA in the ipsilateral cerebral cortex and arrowheads indicate areas of increased TLR expression in the ipsilateral hippocampus compared with the corresponding area of the contralateral hemisphere.X–Zb, Representative epifluorescence photomicrographs of coronal brain slices immunostained for high-mobility group protein B1 (HMGB1), at 24 h (X,Y) and 3 d (Z–Zc) after hypoxia–ischemia. There was a marked decrease in the expression of HMGB1 in the damaged regions of the ipsilateral hippocampus (arrows in X and Z) and of the ipsilateral cerebral cortex (arrow in Zb) compared with the contralateral hemisphere (Y, Za, Zc) in the acute phase of the injury. Contra, Contralateral hemisphere; cx, cerebral cortex; cy, porencephalic cyst; dg, dentate gyrus; hp, hippocampus; ipsi, ipsilateral hemisphere; lv, lateral ventricle. Scale bars: A–G, L–W, 500 μm; H–K, X–Zc, 200 μm.
Figure 5.
Figure 5.
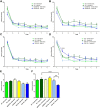
TRIF signaling protects female mice from long-term cognitive and motor impairments after neonatal hypoxia–ischemia. A–D, The T-water maze task was used to assess spatial learning 12 weeks after the surgery. To evaluate the role of TLR signaling in the development of cognitive deficits, MyD88 KO (A, B) mice and TRIF KO hypoxic–ischemic mice (C, D) were compared with their corresponding sham-operated controls and with hypoxic–ischemic WT mice. Hypoxic–ischemic TRIF KO female mice were the only group to exhibit a prolonged latency to reach the platform in the second trial of this learning test compared with their corresponding sham-operated control group (D; ***p < 0.001, two-way ANOVA with Bonferroni post hoc test). E, F, The rotarod performance test was used to evaluate motor function 5 weeks after the injury. Similarly, hypoxic–ischemic TRIF KO females were the only group to exhibit a decreased time to fall from the rotarod compared with sham-operated TRIF KO females and hypoxic–ischemic WT females (F; **p < 0.01 and ***p < 0.001, respectively, two-way ANOVA with Bonferroni post hoc test). Results are expressed as mean ± SEM.
Figure 6.
Figure 6.
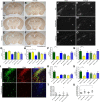
TRIF-deficient male mice have an increased hypoxic–ischemic hippocampal atrophy. A–F, Representative photomicrographs of NeuN-immunostained coronal brain sections 14 weeks after the injury. G, H, No differences were observed in hippocampal CA1/CA2 damage (assessed as the ratio of ipsilateral/contralateral areas) among HI MyD88 KO, HI TRIF KO, and HI WT (G) mice. HI TRIF male mice exhibited an increased hippocampal CA3 injury compared with HI WT male mice (H; *p < 0.05, Kruskal–Wallis test followed by Dunn's test). I, Confocal photomicrographs demonstrating the expression of the activation marker CD68 (in red) in Iba1-positive microglia (in green) in the ipsilateral and contralateral hippocampus at 3 d after injury. Nuclear staining with DAPI is shown in blue. J–O, Representative epifluorescence photomicrographs of coronal brain slices immunostained for CD68 showing the hippocampal region 3 d after the injury. P–S, HI WT male mice exhibited significantly higher ratios of ipsilateral/contralateral Iba1-positive (P, R) and CD68-positive (Q, S) activated microglial cells in the hippocampal CA1/2 (P, Q) and CA3 (R, S) regions compared with HI MyD88 KO male mice (P–S; **p < 0.01, ***p < 0.001, Kruskal–Wallis test with Dunn's multiple-comparisons test). T, U, Quantification of IFN-β and IL-1β mRNA expression in the brains of HI WT and HI TRIF KO mice 3 d after the injury as analyzed by qRT-PCR. Results were normalized to Hprt1 expression (*p < 0.05, Kruskal–Wallis test with Dunn's multiple-comparisons test). Dg, Dentate gyrus. Results are expressed as mean ± SEM (G, H, P–S) or as individual data with mean ± SEM (T, U). Scale bars: I, 40 μm; J–O, 200 μm; A–F, 1 mm.
Figure 7.
Figure 7.
CX3CR1 signaling protects female mice from brain damage and long-term cognitive impairments after neonatal hypoxia–ischemia. A, B, The T-water maze task was used to assess spatial learning 12 weeks after the surgery. HI CX3CR1 KO female mice exhibited a prolonged latency to reach the platform in the second and third trials of this task compared with sham-operated CX3CR1 KO female mice (B; *p < 0.05, **p < 0.01 in each trial, respectively, two-way ANOVA with Bonferroni post hoc test). C–L, Representative dark-field photomicrographs showing the expression of CTGF mRNA, a marker of subplate neurons in the early postnatal mouse brain, in the ipsilateral (C, E, G, I, K) and contralateral (D, F, H, J, L) hemispheres 3 d after the insult. Arrows point to areas with a decreased expression of CTGF in the damaged subplate (C, E, G, I, K) and arrowheads indicate cortical regions where CTGF mRNA expression was induced after the injury (K). M, Scoring used to evaluate changes in the expression of CTGF mRNA in the subplate region 3 d after the insult. HI CX3CR1 KO female mice exhibited an increased subplate damage score, compared with HI WT females (*p < 0.05, Kruskal–Wallis test with Dunn's multiple-comparisons test). N–Q, Representative photomicrographs of NeuN-immunostained coronal brain sections 14 weeks after the injury. R, S, HI CX3CR1 KO female also had a more pronounced hippocampal injury (assessed as the ratio of ipsilateral/contralateral areas) in both CA1/2 (R) and CA3 regions (S) compared with HI WT females (*p < 0.05, Kruskal–Wallis test followed by Dunn's test). Results are expressed as mean ± SEM (A, B, R, S) or as individual data with mean ± SEM (M). Scale bars: C–L, 200 μm; N–Q, 1 mm.
Figure 8.
Figure 8.
Reactive microgliosis in the brains of CX3CR1 KO mice after neonatal hypoxia–ischemia. A–D, Representative epifluorescence photomicrographs of coronal brain slices immunostained for CD68 showing the hippocampal region 3 d after the injury. E–H, Quantification of the number of Iba1-positive microglia (E, G) and CD68-positive activated microglial cells (F, H) in the hippocampal CA1/2 (E, F) and CA3 (G, H) regions of HI WT and CX3CR1 KO mice 3 d after the injury. I, Quantification of IL-1β mRNA expression in the brains of HI WT and HI CX3CR1 KO mice 3 d after the injury as assessed by qRT-PCR. Results were normalized to Hprt1 expression. Dg, Dentate gyrus. Results are expressed as mean ± SEM (E–H) or as individual data with mean ± SEM (I). Scale bar: (in A) A–D, 200 μm.

Similar articles

Cited by

References

    1. Arteni NS, Pereira LO, Rodrigues AL, Lavinsky D, Achaval ME, Netto CA. Lateralized and sex-dependent behavioral and morphological effects of unilateral neonatal cerebral hypoxia-ischemia in the rat. Behav Brain Res. 2010;210:92–98. doi: 10.1016/j.bbr.2010.02.015. - DOI - PubMed
    1. Aubry C, Corr SC, Wienerroither S, Goulard C, Jones R, Jamieson AM, Decker T, O'Neill LA, Dussurget O, Cossart P. Both TLR2 and TRIF contribute to interferon-beta production during Listeria infection. PLoS One. 2012;7:e33299. doi: 10.1371/journal.pone.0033299. - DOI - PMC - PubMed
    1. Beaino G, Khoshnood B, Kaminski M, Pierrat V, Marret S, Matis J, Ledésert B, Thiriez G, Fresson J, Roz é JC, Zupan-Simunek V, Arnaud C, Burguet A, Larroque B, Bréart G, Ancel PY. Predictors of cerebral palsy in very preterm infants: the EPIPAGE prospective population-based cohort study. Dev Med Child Neurol. 2010;52:e119–125. doi: 10.1111/j.1469-8749.2010.03612.x. - DOI - PubMed
    1. Blomster LV, Vukovic J, Hendrickx DA, Jung S, Harvey AR, Filgueira L, Ruitenberg MJ. CX(3)CR1 deficiency exacerbates neuronal loss and impairs early regenerative responses in the target-ablated olfactory epithelium. Mol Cell Neurosci. 2011;48:236–245. doi: 10.1016/j.mcn.2011.08.004. - DOI - PubMed
    1. Cameron JS, Alexopoulou L, Sloane JA, DiBernardo AB, Ma Y, Kosaras B, Flavell R, Strittmatter SM, Volpe J, Sidman R, Vartanian T. Toll-like receptor 3 is a potent negative regulator of axonal growth in mammals. J Neurosci. 2007;27:13033–13041. doi: 10.1523/JNEUROSCI.4290-06.2007. - DOI - PMC - PubMed

Publication types

MeSH terms

Substances

LinkOut - more resources