. 2013 Jul 10;33(28):11618-32.
doi: 10.1523/JNEUROSCI.0012-13.2013.

Distinct roles for somatically and dendritically synthesized brain-derived neurotrophic factor in morphogenesis of dendritic spines

Affiliations

Distinct roles for somatically and dendritically synthesized brain-derived neurotrophic factor in morphogenesis of dendritic spines

Lauren L Orefice et al. J Neurosci. .

Abstract

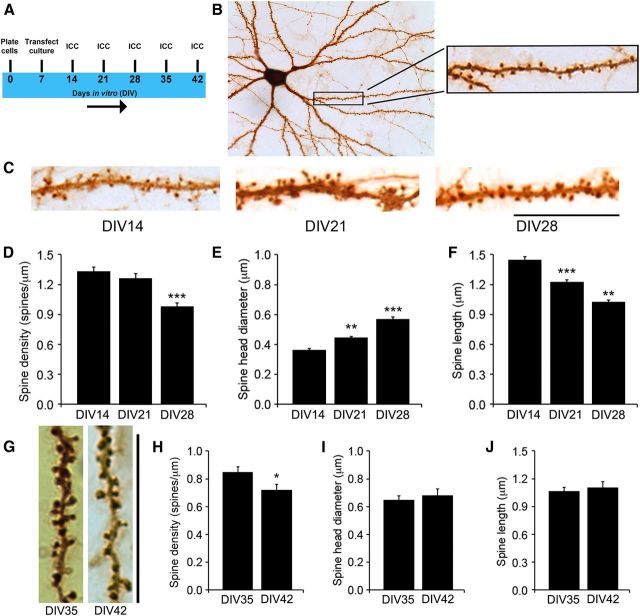
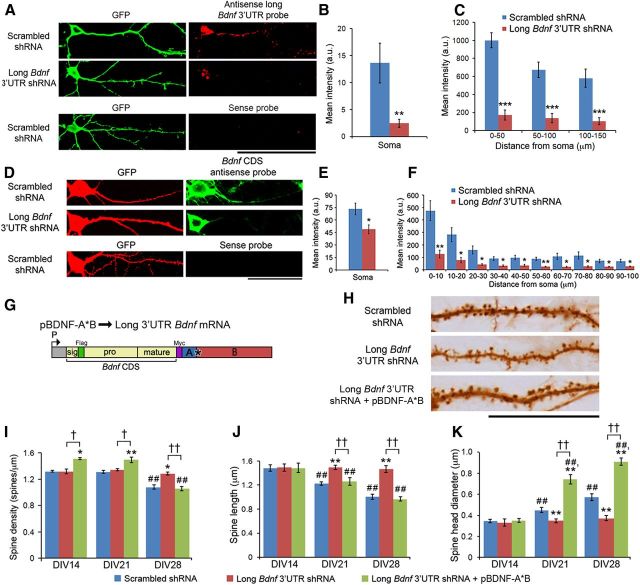
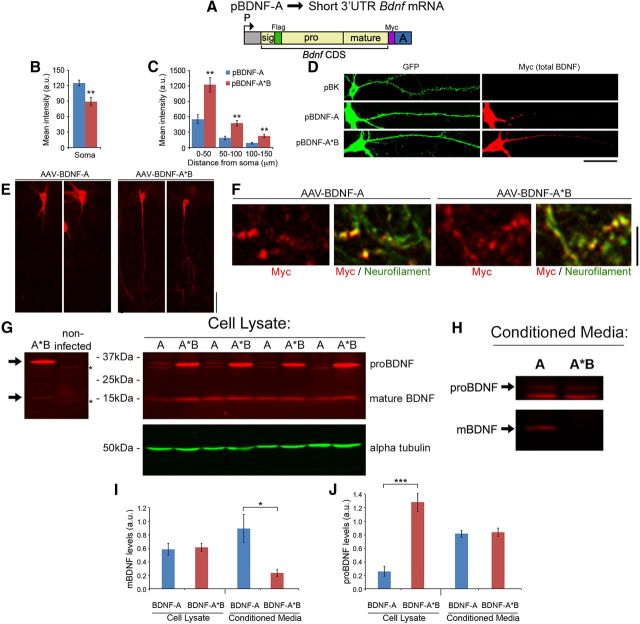
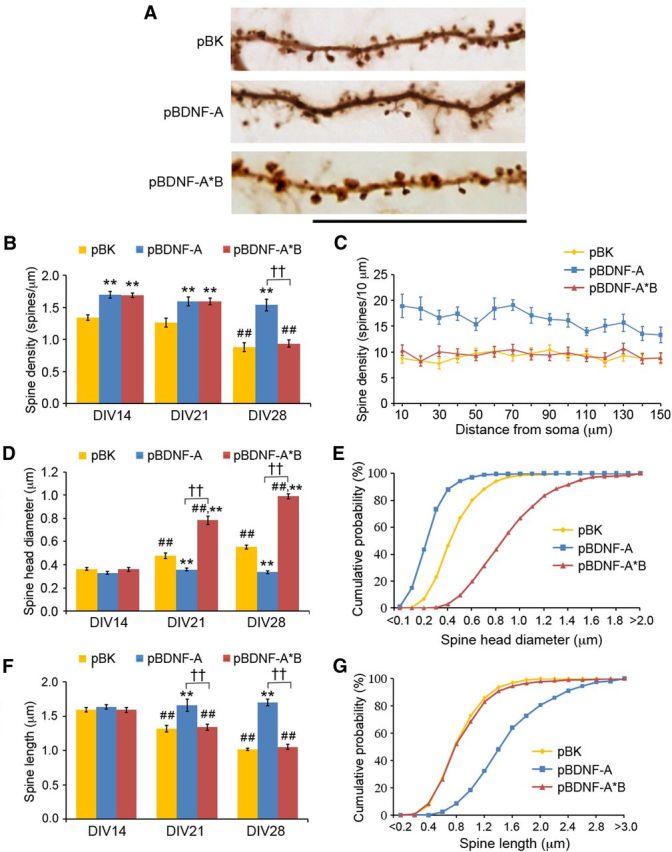
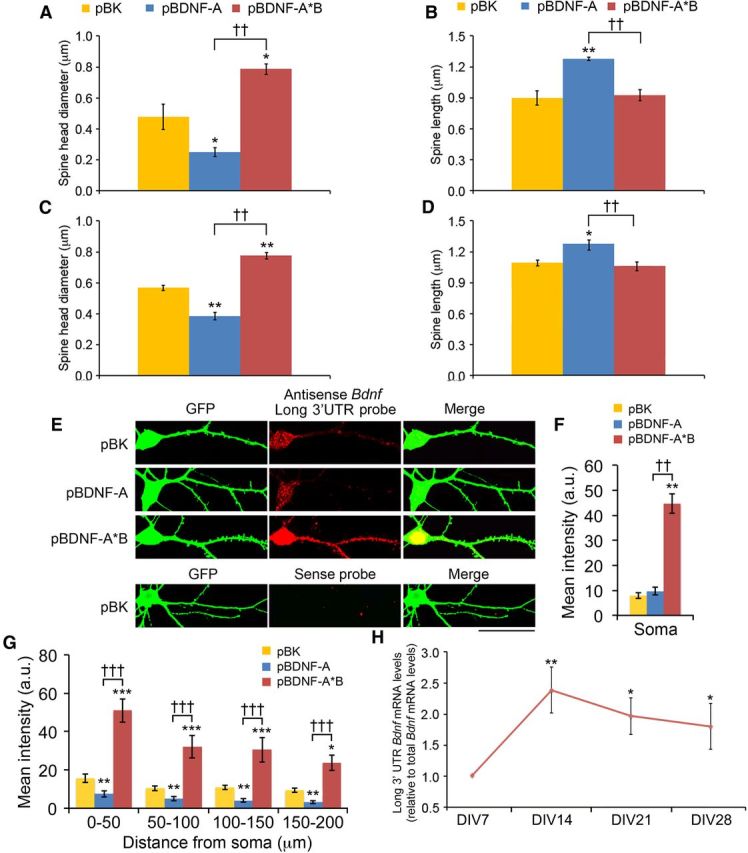
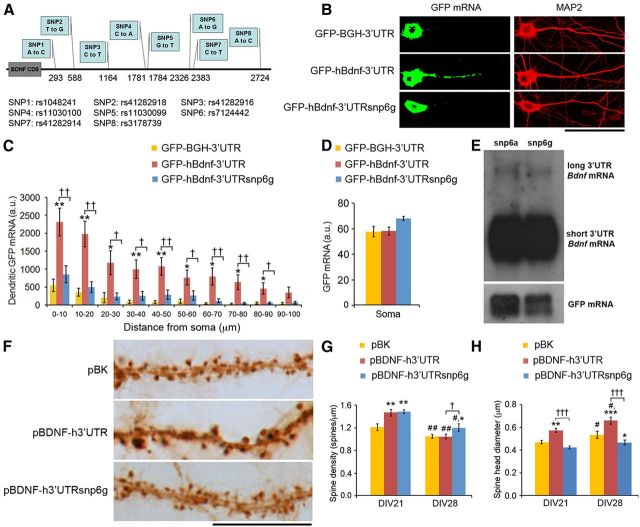
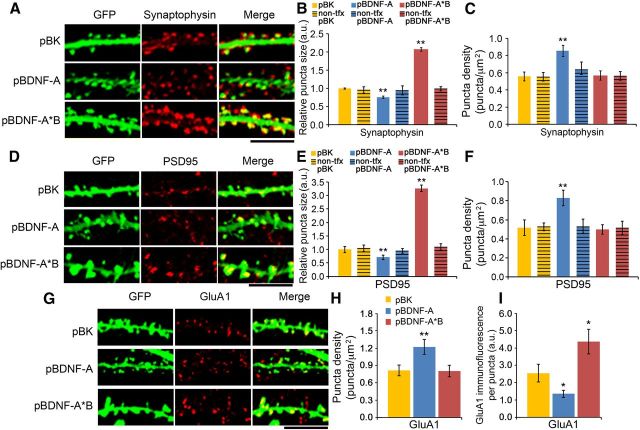
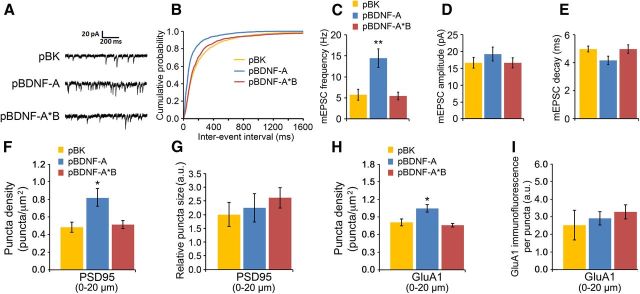
Dendritic spines undergo the processes of formation, maturation, and pruning during development. Molecular mechanisms controlling spine maturation and pruning remain largely unknown. The gene for brain-derived neurotrophic factor (BDNF) produces two pools of mRNA, with either a short or long 3' untranslated region (3' UTR). Our previous results show that short 3' UTR Bdnf mRNA is restricted to cell bodies, whereas long 3' UTR Bdnf mRNA is also trafficked to dendrites for local translation. Mutant mice lacking long 3' UTR Bdnf mRNA display normal spines at 3 weeks of age, but thinner and denser spines in adults compared to wild-type littermates. These observations suggest that BDNF translated from long 3' UTR Bdnf mRNA, likely in dendrites, is required for spine maturation and pruning. In this study, using rat hippocampal neuronal cultures, we found that knocking down long 3' UTR Bdnf mRNA blocked spine head enlargement and spine elimination, whereas overexpressing long 3' UTR Bdnf mRNA had the opposite effect. The effect of long 3' UTR Bdnf mRNA on spine head enlargement and spine elimination was diminished by a human single-nucleotide polymorphism (SNP, rs712442) in its 3' UTR that inhibited dendritic localization of Bdnf mRNA. Furthermore, we found that overexpression of either Bdnf mRNA increased spine density at earlier time points. Spine morphological alterations were associated with corresponding changes in density, size, and function of synapses. These results indicate that somatically synthesized BDNF promotes spine formation, whereas dendritically synthesized BDNF is a key regulator of spine head growth and spine pruning.


Figures

Figure 1.
Figure 1.
Establishment of an in vitro system for the analysis of spine morphogenesis. A, Timeline of transfection with pActin-GFP and fixation for immunocytochemistry of cultured rat hippocampal neurons. B, A cultured rat hippocampal neuron at DIV28, stained with an antibody to GFP. C, Representative dendritic segments from transfected and stained neurons at DIV14, DIV21, and DIV28, showing density and morphology of dendritic spines. D, Density of dendritic spines in cultured neurons at DIV14, DIV21, and DIV28 (n = 10 neurons for each time point). E, Head diameter of dendritic spines in cultured neurons at DIV14, DIV21, and DIV28 (n = 10 neurons for each time point). F, Length of dendritic spines in cultured neurons at DIV14, DIV21, and DIV28 (n = 10 neurons for each time point). G, Representative images of dendrites from neurons transfected with pActin-GFP, showing spine morphology at DIV35 and DIV42. H–J, Density, head diameter, and length of dendritic spines in cultured neurons expressing actin-GFP at DIV35 and DIV42 (n = 10 neurons/condition). Note that the data presented in D–F and H–J were obtained from different experiments. Scale bars: 25 μm. *p < 0.05, compared to the earlier time point (Student's t test); **p < 0.01, ***p < 0.001, compared to the DIV14 time point (one-way ANOVA with post hoc Bonferroni's correction).
Figure 2.
Figure 2.
Knocking down endogenous long 3′ UTR Bdnf mRNA impairs spine head enlargement, spine shortening, and spine density reduction in cultured hippocampal neurons. A, Representative FISH images from neurons transfected with pActin-GFP and a construct expressing either scrambled shRNA or long Bdnf 3′ UTR shRNA. B, Levels of long 3′ UTR Bdnf mRNA in somata of neurons as represented in A. **p < 0.01 (Student's t test; n = 20–22 neurons/condition). C, Levels of long 3′ UTR Bdnf mRNA in dendrites of neurons as represented in A. F(2,120) condition × distance = 3.211; p < 0.05 (two-way ANOVA). ***p < 0.001 (post hoc tests with Bonferroni's correction). D, Representative FISH and immunocytochemistry images from neurons transfected with pActin-GFP and a construct expressing either scrambled shRNA or long Bdnf 3′ UTR shRNA, showing total Bdnf mRNA. E, Levels of total Bdnf mRNA in somata of neurons as represented in D. *p < 0.05 (Student's t test; n = 33 and 26 neurons/condition). F, Levels of total Bdnf mRNA in dendrites of neurons as represented in D. F(9,310) condition × distance = 6.477; p < 0.0001 (two-way ANOVA). *p < 0.05; **p < 0.01 when compared to the scrambled shRNA control at each binned distance (post hoc tests with Bonferroni's correction; n = 19 and 14 neurons/condition). G, Diagram of a construct that expresses mouse long 3′ UTR Bdnf mRNA (pBDNF-A*B). P, Promoter; CDS, coding sequence. H, Representative dendrites of neurons transfected with pActin-GFP and constructs expressing either scrambled shRNA, long Bdnf 3′ UTR shRNA, or long Bdnf 3′ UTR shRNA and mouse long 3′ UTR Bdnf mRNA, showing spine morphology at DIV28. I, Average spine density of neurons as represented in H (n = 10 neurons/condition). F(4,81) condition × DIV = 6.463; p < 0.0001 (two-way ANOVA). J, Average spine head diameter of neurons as represented in H (n = 10 neurons/condition). F(4,81) condition × DIV = 39.56; p < 0.0001 (two-way ANOVA). K, Average spine length of neurons as represented in H (n = 10 neurons/condition). F(4,81) condition × DIV = 13.31; p < 0.0001 (two-way ANOVA). *p < 0.05, **p < 0.01 when compared to scrambled shRNA at the same time point; p < 0.05, ††p < 0.01 when two indicated groups were compared; ##p < 0.01 when compared to the DIV14 time point within the same condition (post hoc tests with Bonferroni's correction). Scale bars: A, 100 μm; D, 50 μm; H, 10 μm.
Figure 3.
Figure 3.
Localization and processing of BDNF translated from short or long 3′ UTR Bdnf mRNA. A, Diagram of a construct that expresses mouse short 3′ UTR Bdnf mRNA (pBDNF-A). P, Promoter; CDS, coding sequence. B, Levels of Myc-tagged BDNF in somata of neurons transfected with either pBDNF-A or pBDNF-A*B. **p < 0.01 (Student's t test; n = 25–27 neurons/condition). C, Levels of Myc-tagged BDNF in dendrites of neurons transfected with either pBDNF-A or pBDNF-A*B. F(2,105) condition × distance = 24.39; p < 0.0001 (two-way ANOVA). **p < 0.01 (post hoc tests with Bonferroni's correction). D, Representative Myc and GFP immunocytochemistry images of DIV28 neurons transfected with pActin-GFP and either pBK (empty vector), pBDNF-A or pBDNF-A*B. E, Representative Myc immunohistochemistry images showing rat hippocampal CA1 neurons injected with AAV-BDNF-A or AAV-BDNF-A*B. F, Representative Myc and neurofilament immunohistochemistry images showing Myc-positive axonal terminals in the CA3 region of granule cells infected with AAV-BDNF-A or AAV-BDNF-A*B. G, Myc immunoblotting of cell lysates from DIV35 neurons infected with either AAV-BDNF-A (A) or AAV-BDNF-A*B (A*B), showing the relative abundance of mature BDNF and proBDNF. The left blot compares cell lysates from transfected and non-transfected neurons to reveal mature and pro-BDNF bands (arrows) and nonspecific bands (asterisks). H, Representative Myc immunoblot of conditioned media from DIV35 neuronal cultures infected with either AAV-BDNF-A (A) or AAV-BDNF-A*B (A*B). I, Quantification of mature BDNF levels in cell lysates and conditioned media from neuronal cultures infected with either AAV-BDNF-A or AAV-BDNF-A*B. *p < 0.05 (Student's t test for comparisons between conditions; cell lysate, n = 8 samples/condition; conditioned media, n = 5 samples/condition). J, Quantification of proBDNF levels in cell lysates and conditioned media from neuronal cultures infected with either AAV-BDNF-A or AAV-BDNF-A*B. ***p < 0.001 (Student's t test for comparisons between conditions; cell lysate, n = 8 samples/condition; conditioned media, n = 5 samples/condition). Scale bars: D, E, 50 μm; F, 10 μm.
Figure 4.
Figure 4.
Short and long 3′ UTR Bdnf mRNAs have distinct roles in spine morphogenesis. A, Representative dendrites of neurons transfected with pActin-GFP and pBK, pBDNF-A, or pBDNF-A*B, showing spine morphology at DIV28. Scale bar, 25 μm. B, Average spine density of neurons transfected with pActin-GFP and pBK, pBDNF-A, or pBDNF-A*B at DIV14, DIV21, and DIV28 (n = 10 neurons/condition). F(4,81) condition × DIV = 7.607; p < 0.0001 (two-way ANOVA). C, Spine density along dendrites of DIV28 hippocampal neurons transfected with pActin-GFP and pBK, pBDNF-A, or pBDNF-A*B. F(20,270) condition × distance = 2.802; p < 0.0001 (two-way ANOVA; n = 10 neurons/condition). D, Average spine head diameter of neurons transfected with pBK, pBDNF-A, or pBDNF-A*B in combination with pActin-GFP at DIV14, DIV21, and DIV28 (n = 10 neurons/condition). F(4,81) condition × DIV = 67.27; p < 0.0001 (two-way ANOVA). E, Cumulative distribution of spine head diameter of neurons transfected with pBK, pBDNF-A, or pBDNF-A*B in combination with pActin-GFP at DIV14, DIV21, and DIV28. F(40,567) condition × diameter = 74.90; p < 0.0001 (two-way ANOVA; n = 10 neurons/condition). F, Average spine length of neurons transfected with pBK, pBDNF-A, or pBDNF-A*B in combination with pActin-GFP at DIV14, DIV21, and DIV28 (n = 10 neurons/condition). F(4,81) condition × DIV = 14.87; p < 0.0001 (two-way ANOVA). G, Cumulative distribution of spine length of neurons transfected with pBK, pBDNF-A, or pBDNF-A*B in combination with pActin-GFP at DIV14, DIV21, and DIV28 (n = 10 neurons/condition). F(58,810) condition × length = 88.28; p < 0.0001 (two-way ANOVA). **p < 0.01 when compared to the pBK control at the same time point; ††p < 0.01 when two indicated groups were compared; ##p < 0.01 when compared to the DIV14 time point within the same condition (post hoc tests with Bonferroni's correction).
Figure 5.
Figure 5.
Effects of overexpressing Bdnf mRNA on dendritic spines and mRNA localization. A, B, Average spine head diameter and spine length of DIV28 neurons transfected with a non-actin-containing GFP construct and pBK, pBDNF-A, or pBDNF-A*B (n = 10 neurons/condition). C, D, Average spine head diameter and spine length of DIV28 neurons transfected with pActin-GFP and pBK, pBDNF-A, or pBDNF-A*B at DIV21 (n = 10 neurons/condition). E, Representative FISH and immunocytochemistry images for DIV19 neurons transfected with pActin-GFP and pBK, pBDNF-A, or pBDNF-A*B. The antisense long Bdnf 3′ UTR probe was used to detect long 3′ UTR Bdnf mRNA. Scale bar, 50 μm. F, Levels of long 3′ UTR Bdnf mRNA in somata (n = 13, 15 and 16 neurons/condition) of neurons as represented in E. **p < 0.01 when compared to the pBK control; ††p < 0.01 when two indicated groups were compared (one-way ANOVA with post hoc Bonferroni's correction; A–D, F). G, Levels of long 3′ UTR Bdnf mRNA in dendrites (n = 12, 13, and 16 neurons/condition) of neurons as represented in E. F(6,144) condition × distance = 1.878; p < 0.0884 (two-way ANOVA). *p < 0.05, **p < 0.01, ***p < 0.001 when compared to the pBK control at the same time point; †††p < 0.001 when two indicated groups were compared (post hoc tests with Bonferroni's correction). H, Relative abundance of long 3′ UTR Bdnf mRNA to total Bdnf mRNA in cultured hippocampal neurons (n = 8 samples per time point, performed in triplicate). *p < 0.05; **p < 0.01 when compared to the DIV7 time point (one-way ANOVA with post hoc Bonferroni's correction).
Figure 6.
Figure 6.
A common human Bdnf SNP impairs mRNA trafficking to dendrites as well as spine head enlargement and spine density reduction in cultured hippocampal neurons. A, Diagram depicting SNP variants in the human 3′ UTR of Bdnf mRNA. B, Representative FISH images from neurons transfected with pGFP-BGH-3′UTR, pGFP-hBdnf-3′UTR, or pGFP-hBdnf3′UTRsnp6g. C, Levels of GFP mRNA in dendrites of neurons transfected with pGFP-BGH-3′UTR, pGFP-hBdnf-3′UTR, or pGFP-hBdnf3′UTRsnp6g (n = 14, 20, and 20 neurons, respectively). *p < 0.05, **p < 0.01 when compared to pGFP-BGH-3′UTR; p < 0.05, ††p < 0.01 when two indicated groups were compared (Student's t test). D, Levels of GFP mRNA in somata of neurons transfected with pGFP-BGH-3′UTR, pGFP-hBdnf-3′UTR, or pGFP-hBdnf3′UTRsnp6g (n = 19, 33, and 30, respectively). Student's t test, not significant. E, Northern blot analysis of Bdnf mRNA from HEK293T cells transfected with pActin-GFP and either pBDNF-h3′UTR (snp6a) or pBDNF-h3′UTRsnp6g (snp6g). F, Representative dendrites of neurons transfected with pActin-GFP and pBK, pBDNF-h3′UTR, or pBDNF-h3′UTRsnp6g showing spine morphology at DIV28. G, Average spine density of neurons transfected with pActin-GFP and pBK, pBDNF-h3′UTR, or pBDNF-h3′UTRsnp6g at DIV21 and DIV28 (n = 10 neurons/condition). F(2,54) condition × DIV = 3.590; p < 0.0345 (two-way ANOVA). H, Average spine head diameter of neurons transfected with pActin-GFP and pBK, pBDNF-h3′UTR, or pBDNF-h3′UTRsnp6g at DIV21 and DIV28 (n = 10 neurons/condition). F(2,54) condition × DIV = 1.132; p value not significant (two-way ANOVA). *p < 0.05, **p < 0.01, ***p < 0.001 when compared to pBK at the same time point; p < 0.05, †††p < 0.001 when two indicated groups were compared; #p < 0.05, ##p < 0.01 when compared to the DIV21 time point within the same condition (post hoc tests with Bonferroni's correction). Scale bars: B, 50 μm; F, 25 μm.
Figure 7.
Figure 7.
BDNF-induced changes in spines correlate with changes in synaptic structure and composition. A, Representative immunocytochemistry images for GFP and synaptophysin from neurons transfected with pActin-GFP and pBK, pBDNF-A, or pBDNF-A*B at DIV28. B, Size of synaptophysin puncta for neurons transfected with pBK, pBDNF-A, or pBDNF-A*B in combination with pActin-GFP or nontransfected (non-tfx) neurons on the same coverslips at DIV28 (n = 10–13 neurons/condition). C, Density of synaptophysin puncta for neurons transfected with pBK, pBDNF-A, or pBDNF-A*B in combination with pActin-GFP or nontransfected neurons on the same coverslips at DIV28 (n = 10–13 neurons/condition). D, Representative immunocytochemistry images for GFP and PSD95 from neurons transfected with pActin-GFP and pBK, pBDNF-A, or pBDNF-A*B at DIV28. E, Size of PSD-95 puncta for neurons transfected with pBK, pBDNF-A, or pBDNF-A*B in combination with pActin-GFP or nontransfected neurons on the same coverslips at DIV28 (n = 10–13 neurons/condition). F, Density of PSD-95 puncta for neurons transfected with pBK, pBDNF-A, or pBDNF-A*B in combination with pActin-GFP or nontransfected neurons on the same coverslips at DIV28 (n = 10–13 neurons/condition). G, Representative immunocytochemistry images for GFP and surface GluA1 from neurons transfected with pActin-GFP and pBK, pBDNF-A, or pBDNF-A*B at DIV28. H, Surface GluA1 puncta density in neurons transfected with pActin-GFP and pBK, pBDNF-A, or pBDNF-A*B at DIV28 (n = 10 neurons/condition). I, Surface GluA1 immunofluorescence per puncta in neurons transfected with pActin-GFP and pBK, pBDNF-A, or pBDNF-A*B at DIV28 (n = 10 neurons/condition). *p < 0.05; **p < 0.01 when compared to the pBK control (one-way ANOVA with post hoc Bonferroni's correction). Scale bars: 5 μm.
Figure 8.
Figure 8.
BDNF-induced changes in synaptic composition and function in proximal dendrites. A, Representative AMPAR-mediated mEPSC traces from neurons transfected with pActin-GFP and pBK, pBDNF-A, or pBDNF-A*B at DIV27–29. B, Cumulative probability of miniature events of mEPSCs recorded from neurons transfected with pActin-GFP and pBK, pBDNF-A, or pBDNF-A*B at DIV27–29 (n = 12–13 neurons/condition). C, Average frequency of mEPSCs recorded from neurons transfected with pActin-GFP and pBK, pBDNF-A, or pBDNF-A*B at DIV27–29 (n = 12–13 neurons/condition). D, Average amplitude of mEPSCs recorded from neurons transfected with pActin-GFP and pBK, pBDNF-A, or pBDNF-A*B at DIV27–29 (n = 12–13 neurons/condition). One-way ANOVA with post hoc Bonferroni's correction's was not significant. E, Average decay time of mEPSCs recorded from neurons transfected with pActin-GFP and pBK, pBDNF-A, or pBDNF-A*B at DIV27–29 (n = 12–13 neurons/condition). One-way ANOVA with post hoc Bonferroni's correction was not significant. F, Density of PSD95 puncta on the first 20 μm proximal dendrites of neurons transfected with pActin-GFP and pBK, pBDNF-A, or pBDNF-A*B at DIV28 (n = 10 neurons/condition). G, Size of PSD95 puncta on the first 20 μm proximal dendrites of neurons transfected with pActin-GFP and pBK, pBDNF-A, or pBDNF-A*B at DIV28 (n = 10 neurons/condition). One-way ANOVA with post hoc Bonferroni's correction, not significant. H, Density of surface GluA1 puncta on the first 20 μm proximal dendrites of neurons transfected with pActin-GFP and pBK, pBDNF-A, or pBDNF-A*B at DIV28 (n = 10 neurons/condition). I, Immunofluorescence of surface GluA1 puncta on the first 20 μm proximal dendrites of neurons transfected with pActin-GFP and pBK, pBDNF-A, or pBDNF-A*B at DIV28 (n = 10 neurons/condition). One-way ANOVA with post hoc Bonferroni correction was not significant. *p < 0.05; **p < 0.01 when compared to neurons transfected with pBK (one-way ANOVA with post hoc Bonferroni's correction).

Similar articles

Cited by

References

    1. Adachi N, Kohara K, Tsumoto T. Difference in trafficking of brain-derived neurotrophic factor between axons and dendrites of cortical neurons, revealed by live-cell imaging. BMC Neurosci. 2005;6:42. doi: 10.1186/1471-2202-6-42. - DOI - PMC - PubMed
    1. An JJ, Gharami K, Liao GY, Woo NH, Lau AG, Vanevski F, Torre ER, Jones KR, Feng Y, Lu B, Xu B. Distinct role of long 3′ UTR BDNF mRNA in spine morphology and synaptic plasticity in hippocampal neurons. Cell. 2008;134:175–187. doi: 10.1016/j.cell.2008.05.045. - DOI - PMC - PubMed
    1. Bhatt DH, Zhang S, Gan WB. Dendritic spine dynamics. Annu Rev Physiol. 2009;71:261–282. doi: 10.1146/annurev.physiol.010908.163140. - DOI - PubMed
    1. Brummelkamp TR, Bernards R, Agami R. A system for stable expression of short interfering RNAs in mammalian cells. Science. 2002;296:550–553. doi: 10.1126/science.1068999. - DOI - PubMed
    1. Churchill JD, Grossman AW, Irwin SA, Galvez R, Klintsova AY, Weiler IJ, Greenough WT. A converging-methods approach to fragile X syndrome. Dev Psychobiol. 2002;40:323–338. doi: 10.1002/dev.10036. - DOI - PubMed

Publication types

Substances

LinkOut - more resources