. 2013 Jul 10;33(28):11677-91.
doi: 10.1523/JNEUROSCI.5729-12.2013.

Input-output features of anatomically identified CA3 neurons during hippocampal sharp wave/ripple oscillation in vitro

Affiliations

Input-output features of anatomically identified CA3 neurons during hippocampal sharp wave/ripple oscillation in vitro

Norbert Hájos et al. J Neurosci. .

Abstract

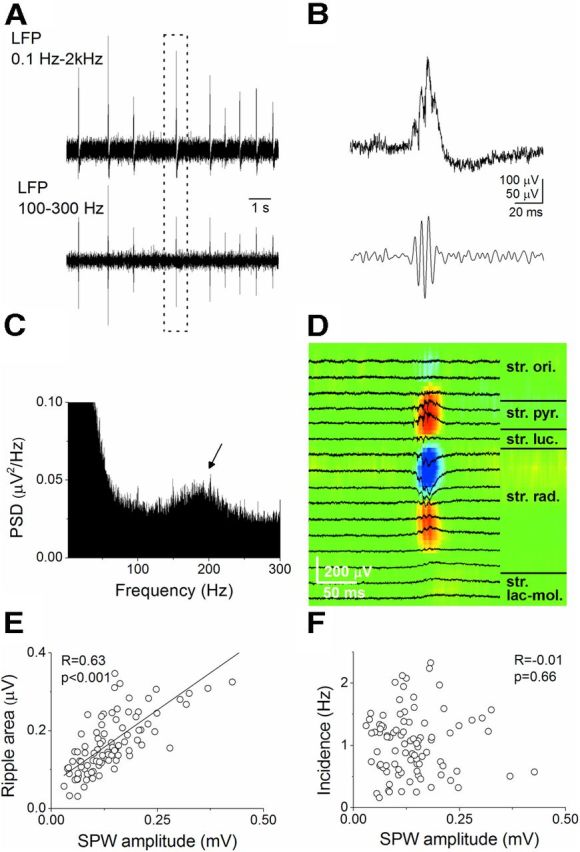
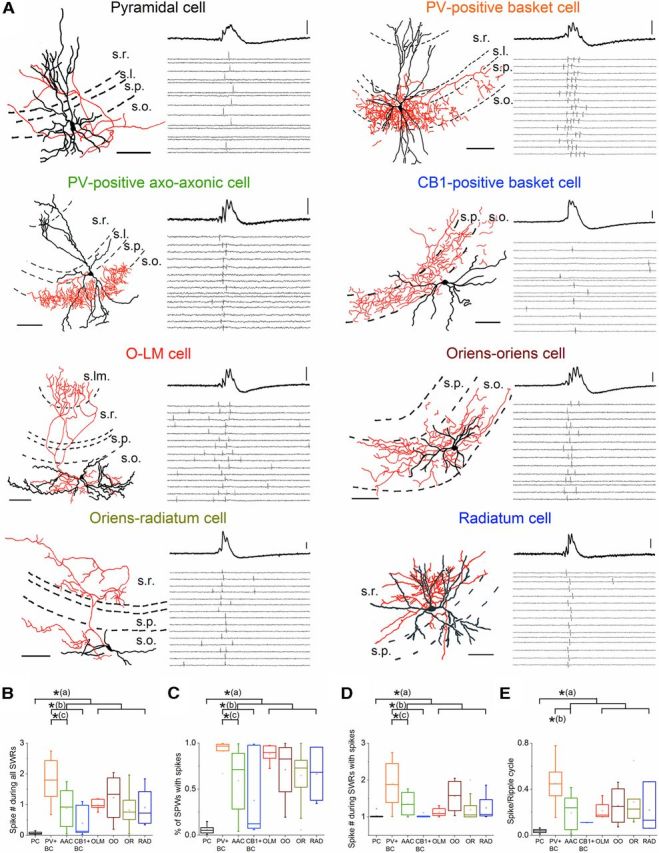
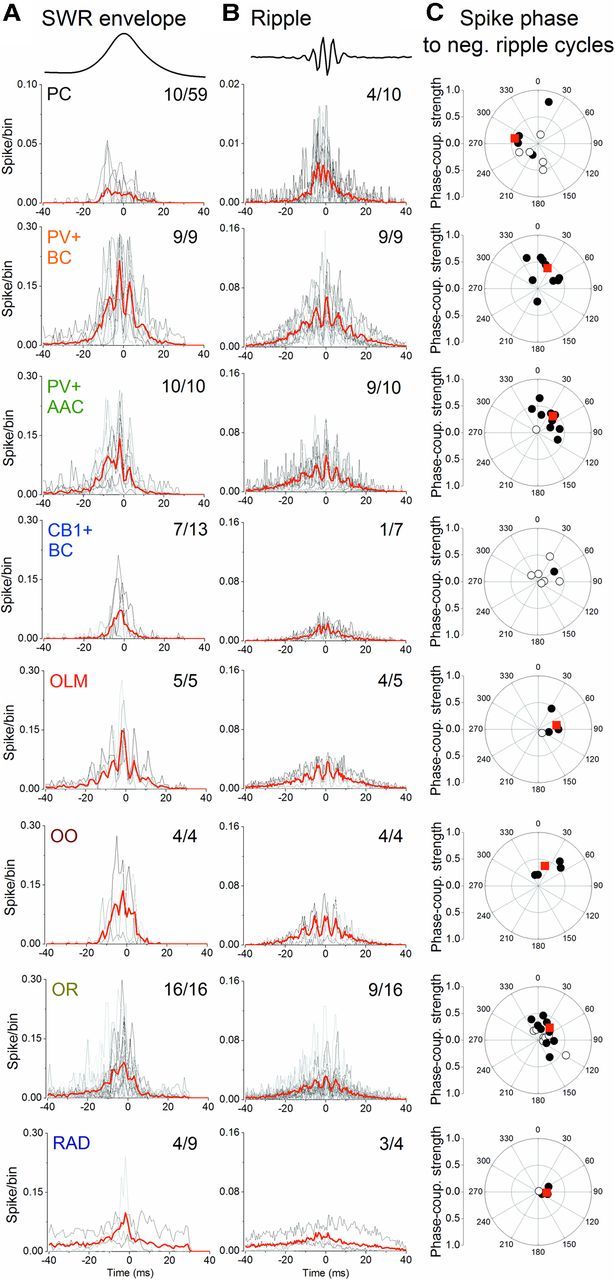
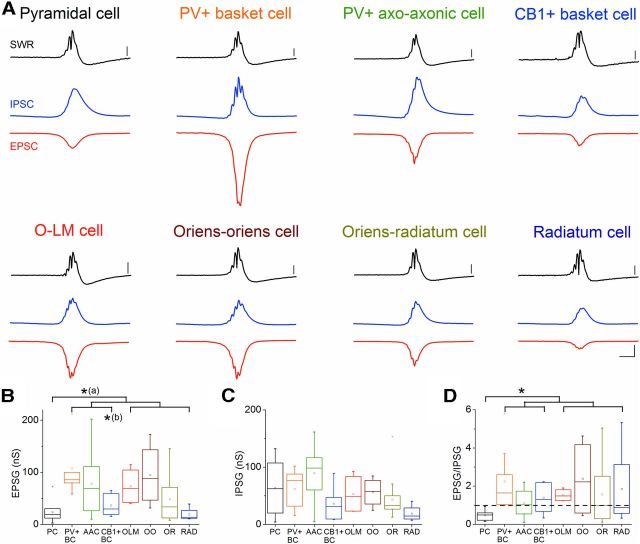
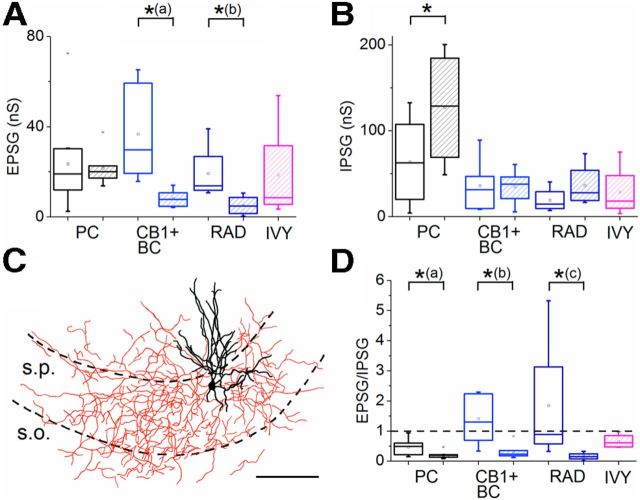
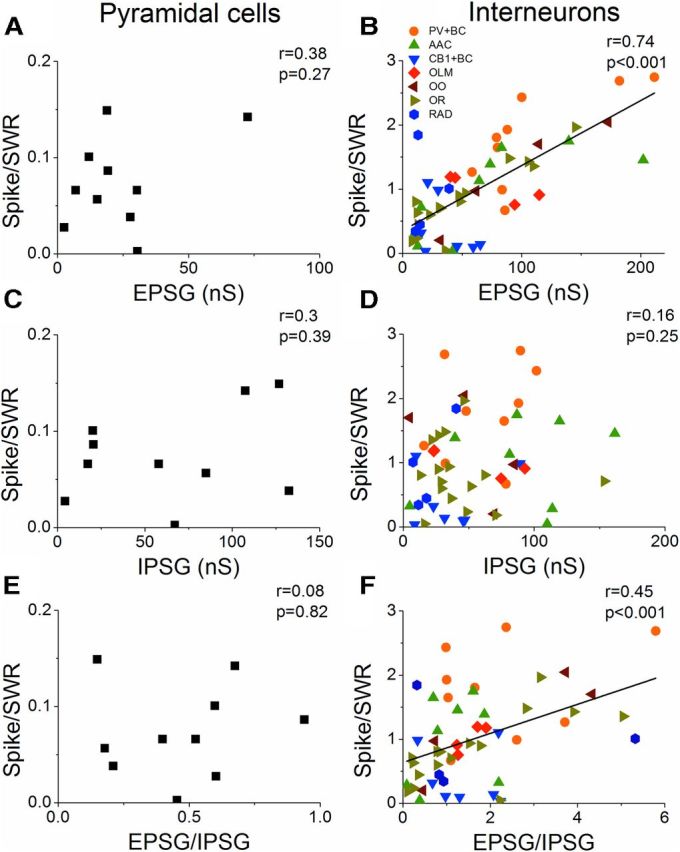
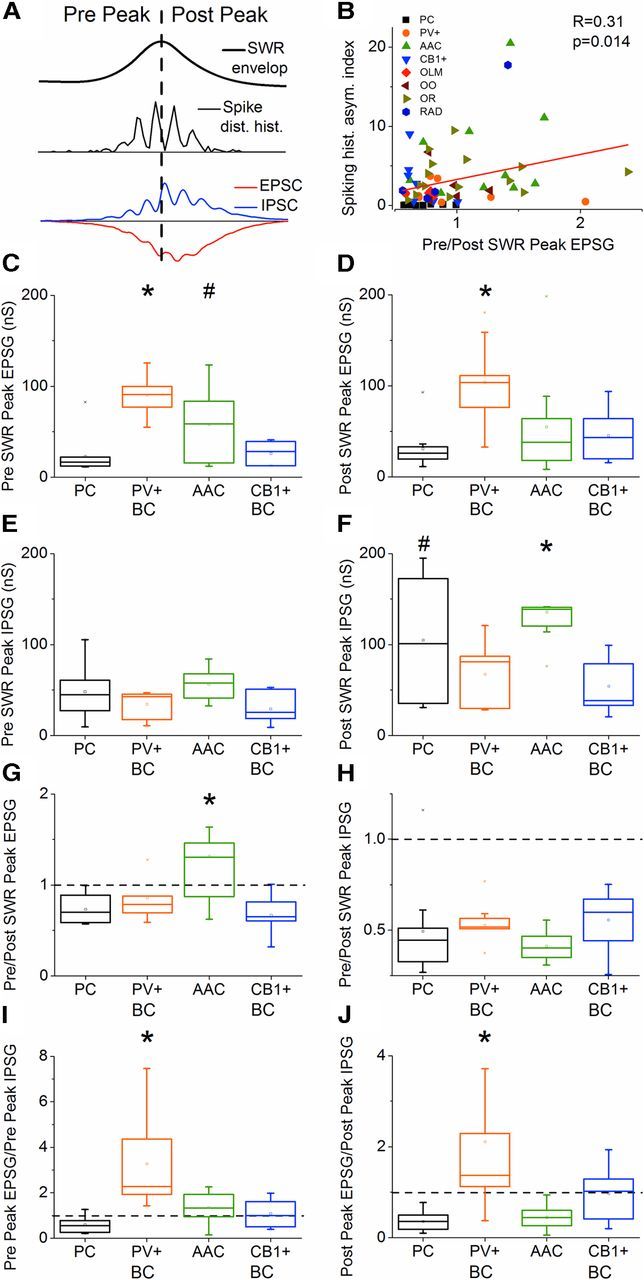
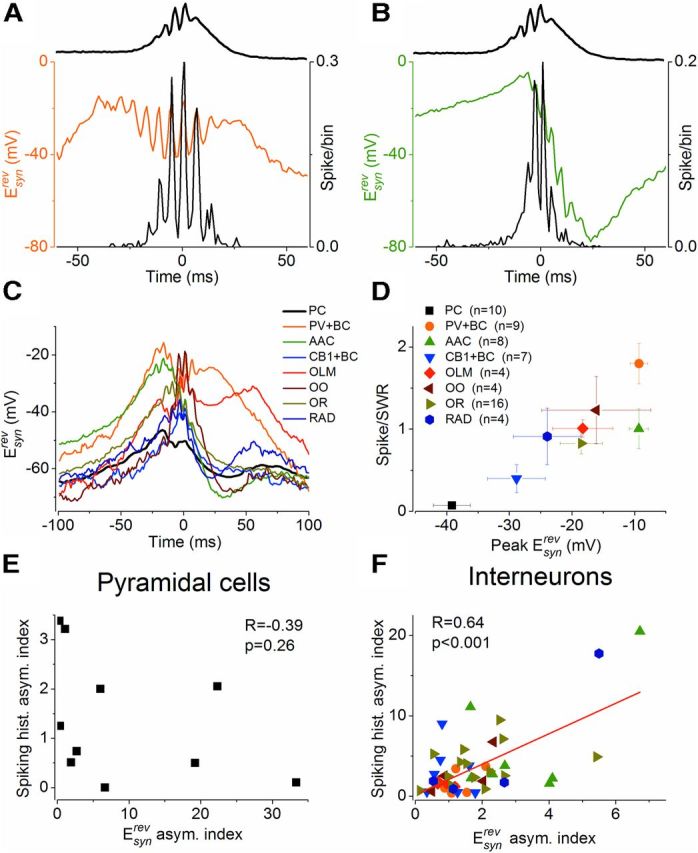
Hippocampal sharp waves and the associated ripple oscillations (SWRs) are implicated in memory processes. These network events emerge intrinsically in the CA3 network. To understand cellular interactions that generate SWRs, we detected first spiking activity followed by recording of synaptic currents in distinct types of anatomically identified CA3 neurons during SWRs that occurred spontaneously in mouse hippocampal slices. We observed that the vast majority of interneurons fired during SWRs, whereas only a small portion of pyramidal cells was found to spike. There were substantial differences in the firing behavior among interneuron groups; parvalbumin-expressing basket cells were one of the most active GABAergic cells during SWRs, whereas ivy cells were silent. Analysis of the synaptic currents during SWRs uncovered that the dominant synaptic input to the pyramidal cell was inhibitory, whereas spiking interneurons received larger synaptic excitation than inhibition. The discharge of all interneurons was primarily determined by the magnitude and the timing of synaptic excitation. Strikingly, we observed that the temporal structure of synaptic excitation and inhibition during SWRs significantly differed between parvalbumin-containing basket cells, axoaxonic cells, and type 1 cannabinoid receptor (CB1)-expressing basket cells, which might explain their distinct recruitment to these synchronous events. Our data support the hypothesis that the active current sources restricted to the stratum pyramidale during SWRs originate from the synaptic output of parvalbumin-expressing basket cells. Thus, in addition to gamma oscillation, these GABAergic cells play a central role in SWR generation.


Figures

Figure 1.
Figure 1.
SWRs in hippocampal slices. A, In LFP recorded from the stratum pyramidale of the CA3 region, spontaneously occurring SWRs could be observed. Ripple bandpass filtered version of the same trace is shown below. B, Magnification of boxed SWR in A. C, Power spectral density function of the trace in A showing ripple frequency peak (arrow). D, LFP recorded with a laminar multielectrode array was used for calculating the current source density plot (below). A large sink (blue) and source (red) pair is present in the strata radiatum and pyramidale, respectively. The figure shows an individual LFP signal and a CSD obtained from this example signal. E, Correlation between the sharp wave (SPW) amplitude and ripple area. F, The rate of SWRs was independent of sharp wave amplitude. Each point on these plots is an averaged value from individual experiments (n = 79).
Figure 2.
Figure 2.
Firing properties of anatomically identified neurons in CA3 during SWRs. A, Camera lucida reconstructions of intracellularly labeled neurons from each group are presented (dendrites, black; axon, red). Scale bars, 100 μm. Spiking of individual neurons detected in loose patch mode was concomitantly recorded with SWRs. The firing activity of neurons during 15 consecutive SWRs are shown below the averaged SWRs (calculated from 50 events) for each case. Individual spikes are the positive deflections on the traces. Scale bar, 50 μV. B, PCs discharged the lowest number of spikes during SWRs than interneurons (Ba, p < 0.001); perisomatic region-targeting interneurons and dendritic layer-innervating interneurons emitted similar number of spikes on average (p = 0.44); PV+BCs spiked more than AACs and CB1+BCs (Bb, p < 0.001 for PV+BC vs CB1+BC; Bc, p = 0.005 for PV+BC vs AACs; p = 0.14 for AAC vs CB1+BC); no difference was found in cell types innervating the dendritic layers (p = 0.62). C, Although perisomatic region-targeting interneurons and dendritic layer-innervating interneurons fired similarly during most SWRs (p = 0.54), PCs only spiked during smaller proportion, ∼6% of these synchronous events on average (Ca, p < 0.001). Again, perisomatic region-targeting interneurons and dendritic layer-innervating interneurons emitted similar number of spikes on average (p = 0.54); PV+BCs spiked more than AACs and CB1+BCs (Cb, p = 0.003 for PV+BC vs CB1+BC; Cc, p = 0.04 for PV+BC vs AACs; p = 0.19 for AAC vs CB1+BC); no difference was found in cell types innervating the dendritic layers (p = 0.46). D, Compared with all interneurons, pyramidal cells fired less action potentials during those SWRs, when the cell fired (Da, p < 0.001), while in perisomatic region-targeting interneurons and dendritic layer-innervating interneurons number of spikes emitted did not differ (p = 0.082). Among perisomatic region-targeting interneurons, PV+BCs spiked more than AACs and CB1+BCs (Db, p < 0.001 for PV+BC vs CB1+BC, p = 0.008 for PV+BC vs AACs; p = 0.12 for AAC vs CB1+BC), whereas no difference was found in cell types innervating the dendritic layers (p = 0.21). E, Pyramidal cells emitted significantly less spikes during ripple cycles than interneurons (Ea, p = 0.014), whereas perisomatic region-targeting interneurons and dendritic layer-innervating interneurons discharged similar number of spikes (p = 0.36). In addition, PV+ BCs discharged more spike during a ripple cycle than AACs (Eb, p = 0.005), but cell types in the dendritic layer-innervating group discharged similar number of action potentials. In this graph only those neurons were included where the phase-coupling was significant (Rayleigh probability test; pr <0.05). Here on the box charts and in Figures 4, 5, 7, the mean (small open square), the median (midline of the big box), the interquartile range (large box), the 5/95% values (end of the whiskers), and the minimal/maximal values (bottom and top X symbols) are shown. Asterisk labels the significant differences. See Table 1 for details.
Figure 3.
Figure 3.
Spike distribution histograms of CA3 neurons during SWRs. A, Spike distribution histograms shown for individual neurons (gray) and their average (red) relative to the peak of the SWR envelop. In some neuron types, the asymmetry of the spike histograms relative to the SWR envelop peak is pronounced. Numbers in the top-right indicate the number of neurons that discharged during SWRs from all recorded and anatomically identified neurons. B, Spike distribution histograms for each neuron (gray) and their average (red) relative to the peak of the largest negative ripple cycle. Numbers in the upper right indicate the number of neurons whose spiking was phase-coupled to ripple oscillation (Rayleigh probability test; pr < 0.05). C, Polar plots indicate the phase and the strength of the ripple phase-coupled (black circle) and nonphase coupled (open circle) individual neurons. Red circle indicates the mean phase and strength calculated only from data of phase-coupled cells. See Table 1 for details.
Figure 4.
Figure 4.
Excitatory and inhibitory synaptic inputs during SWRs. A, For each cell type, averaged SWRs, EPSCs recorded at holding potentials between −75 and −85 mV and IPSCs at 0 and +20 mV are shown. These traces were calculated from the averaged traces obtained in all neurons that spiked during SWRs (EPSC, red; IPSC, blue). Scale bars, 50 μV for SWRs; 100 pA and 25 ms for PSCs. B, EPSG recorded during SWRs was significantly smaller in pyramidal cells than in interneurons (Ba, p = 0.003), whereas EPSG was similar in perisomatic region-targeting interneurons and dendritic layer-innervating inhibitory cells (p = 0.14). Furthermore, EPSGs recorded in CB1+BCs were smaller in magnitude than in PV+ BCs (Bb, p = 0.008), while other comparisons did not reveal any differences between perisomatic region-targeting interneurons (p > 0.3), or between those cell groups targeting the dendritic region of pyramidal cells (p = 0.066). C, IPSG during SWRs was similar in pyramidal cells and interneurons. D, The ratio of EPSG and IPSG during SWRs was smaller for PCs than those calculated for interneurons (p < 0.001), but in interneurons there was no significant difference in this ratio (p = 0.69). See Table 2 for details.
Figure 5.
Figure 5.
Comparison of synaptic conductances during SWRs in spiking and nonspiking neurons. A, EPSG during SWRs was similar in spiking and nonspiking pyramidal cells, but spiking interneurons received larger synaptic excitation than their nonspiking pairs (open, spiking neurons; dashed, nonspiking neurons, Aa, p = 0.005; Ab, p = 0.03). Only nonspiking ivy cells were observed (n = 5). B, IPSG measured during SWRs was significantly smaller in spiking pyramidal cells than in nonspiking ones (p = 0.02); however, there was no difference in IPSG magnitude in interneurons. C, A camera lucida reconstruction of an ivy cell (dendrites, black; axon, red). Scale bar, 100 μm. D, Larger EPSG to IPSG ratio characterizes spiking than nonspiking cells. This ratio was significantly larger for pyramidal cells (Da, p = 0.02), for CB1+BCs (Db, p = 0.008) and for RAD cells (Dc, p = 0.048). EPSG/IPSG ratio for ivy cells was below one. See Table 2 for details.
Figure 6.
Figure 6.
Relationship between the spike number during SWRs and synaptic conductance. A, B, Spike number during SWRs is plotted against excitatory postsynaptic conductance (EPSG) for individual cells. Color coded symbols represent different cell groups. Significant correlation was found between EPSG and the number of spikes during SWRs in interneurons. C, D, Spike number during SWRs showed no correlation with inhibitory postsynaptic conductance (IPSG) for pyramidal cells or interneurons. E, F, Spike number during SWRs plotted against EPSG/IPSG ratio showed positive correlation in interneurons, but not in pyramidal cells. In B, F, least-square fit lines are shown.
Figure 7.
Figure 7.
Temporal structure of synaptic inputs relative to the SWR peak. A, A spike distribution histogram, averaged EPSC and IPSC recorded in a PV+ basket cell aligned to the SWR peak illustrates the method used to estimate the temporal structure of synaptic inputs and its correlation to spiking. B, Pre/post-SWR Peak EPSG showed a weak, but significant correlation with the asymmetry in spike distribution histograms, indicating that asymmetry in excitatory input may, at least in part, account for the observed asymmetry in firing relative to the SWR peak. EPSG before the SWR peak (pre-SWR peak) (C), EPSG after the SWR peak (post-SWR peak) (D), IPSG before the SWR peak (pre-SWR Peak) (E), and IPSG after the SWR peak (post-SWR peak). F), Distinct cell types with similar dendritic arborization are shown. C, D, PV+BCs receive significantly larger EPSGs both before (*PC vs PV+BC, p < 0.001; PV+ BC vs AAC, p = 0.014; PV+ BC cell vs CB1+ BC, p < 0.001;) and after SWR peak (*PC vs PV+BC, p < 0.001; PV+ BC vs AAC, p = 0.01; PV+ BC vs CB1+ BC, p = 0.008) compared with other cell types, whereas EPSGs in AACs are larger only before the SWR peak compared with pyramidal cells or CB1+ BCs (#PC vs AAC, p = 0.006; AAC vs CB1+ BC, p = 0.02). G, The ratios of EPSG before and after the SWR peak in AACs were significantly larger than in other cells types (*PC vs AAC, p < 0.001; PV+ BC vs AAC, p = 0.008; AAC vs CB1+ BC, p < 0.001), whereas no difference was observed in the ratios of IPSG before and after the SWR peak (H). EPSG to IPSG ratios before the SWR peak (I) or following the SWR peak (J) are significantly larger in PV+BCs than in pyramidal cells, AACs or CB1+BCs (I, *PC vs PV+BC, p < 0.001; PV+ BC vs AAC, p = 0.001; PV+ BC cell vs CB1+ BC, p < 0.001; J, *PC vs PV+BC, p < 0.001; PV+ BC vs AAC, p = 0.001; PV+ BC cell vs CB1+ BC, p = 0.026). See Table 3 for details.
Figure 8.
Figure 8.
Interaction between excitatory and inhibitory synaptic conductances during SWRs. For a PV+BC (A) and an AAC (B), the net apparent synaptic reversal potential (Esynrev in color) and the spike distribution histogram during SWRs is overlaid (black). The maximums and the minimums of the spike distribution histograms are tightly coupled to the peaks and the troughs in the ripple-like appearance of Esynrev, respectively, indicating that the excitatory and inhibitory synaptic conductances shape together the firing of these interneurons during SWRs. In addition, the asymmetry in the spike distribution histograms relative to the sharp wave peak matches the asymmetry in Esynrev. Top, SWR averages are shown. C, Averaged Esynrev curves calculated only for neurons spiking during SWRs show cell-type specific appearance. Esynrev in the majority of neuron types reaches its maximum before or around the peak of the sharp waves, followed by the sharp drop toward more negative values. However, Esynrev for PV+BCs and OLM cells, is more symmetric relative to the sharp wave peak unlike Esynrev for other cell types. Curves are the averages of Esynrev obtained in individual cells. D, Relationship between the peak of Esynrev and the number of spikes during SWRs in different cell classes indicates that more spikes are emitted by those neuron types, in which the peak of Esynrev approaches closer the reversal potential of the synaptic excitation. Error bars indicate SEM. E, F, Asymmetry in Esynrev shows significant correlation with the asymmetry in spike distribution histograms for interneurons (F), but not for pyramidal cells (E).

Similar articles

Cited by

References

    1. Behrens CJ, van den Boom LP, de Hoz L, Friedman A, Heinemann U. Induction of sharp wave-ripple complexes in vitro and reorganization of hippocampal networks. Nat Neurosci. 2005;8:1560–1567. doi: 10.1038/nn1571. - DOI - PubMed
    1. Bienvenu TC, Busti D, Magill PJ, Ferraguti F, Capogna M. Cell-type-specific recruitment of amygdala interneurons to hippocampal theta rhythm and noxious stimuli in vivo. Neuron. 2012;74:1059–1074. doi: 10.1016/j.neuron.2012.04.022. - DOI - PMC - PubMed
    1. Borg-Graham LJ, Monier C, Frégnac Y. Visual input evokes transient and strong shunting inhibition in visual cortical neurons. Nature. 1998;393:369–373. doi: 10.1038/30735. - DOI - PubMed
    1. Buhl EH, Halasy K, Somogyi P. Diverse sources of hippocampal unitary IPSPs and the number of synaptic release sites. Nature. 1994;368:823–828. doi: 10.1038/368823a0. - DOI - PubMed
    1. Buzsáki G. Hippocampal sharp waves: their origin and significance. Brain Res. 1986;398:242–252. doi: 10.1016/0006-8993(86)91483-6. - DOI - PubMed

Publication types

LinkOut - more resources