. 2013 Jul 10;33(28):11692-702.
doi: 10.1523/JNEUROSCI.0010-13.2013.

Predictive suppression of cortical excitability and its deficit in schizophrenia

Affiliations

Predictive suppression of cortical excitability and its deficit in schizophrenia

Peter Lakatos et al. J Neurosci. .

Abstract

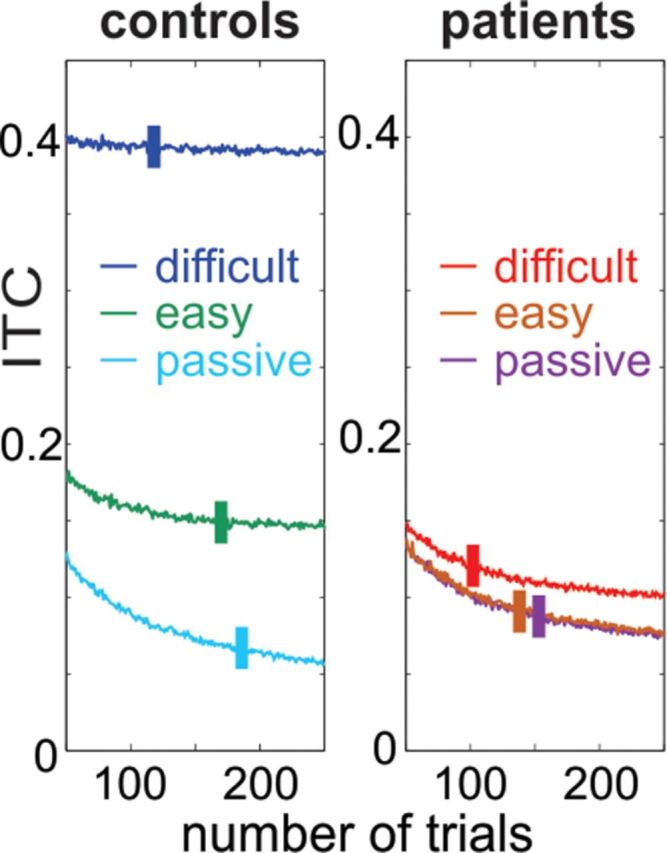
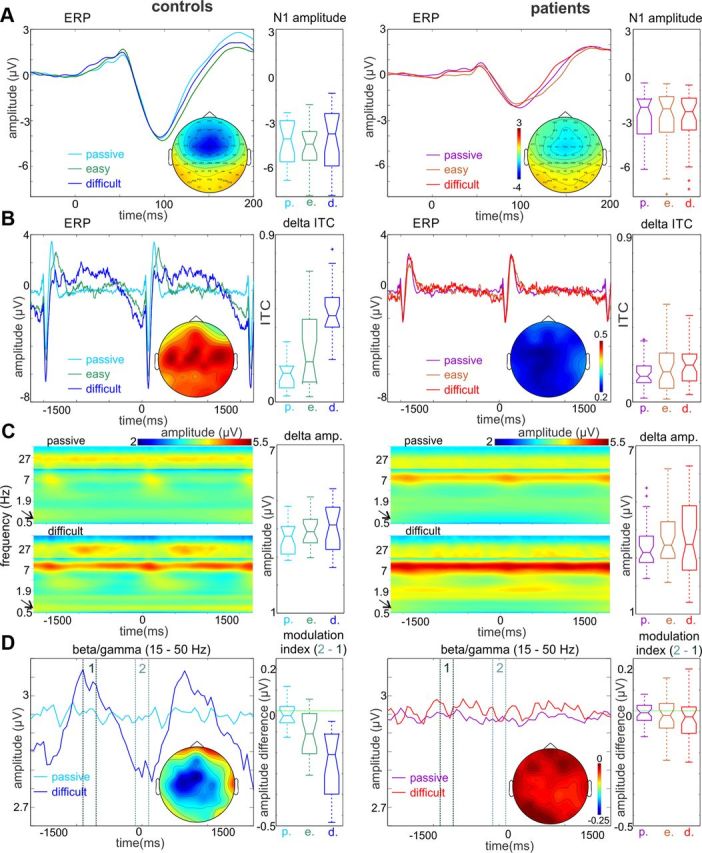
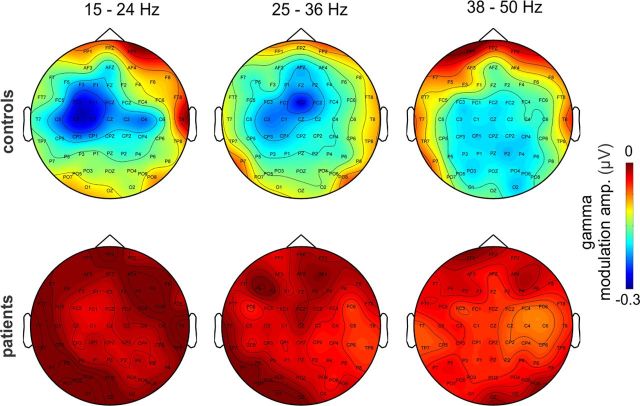
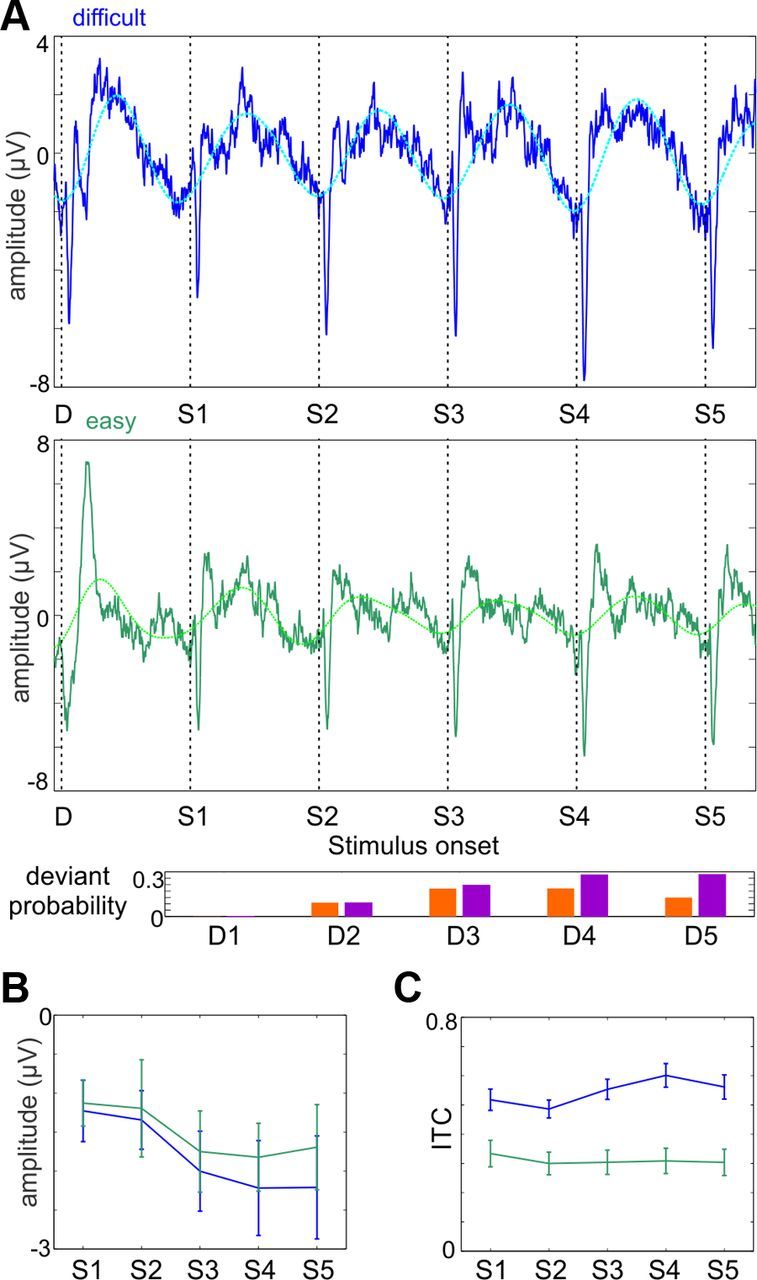
Recent neuroscience advances suggest that when interacting with our environment, along with previous experience, we use contextual cues and regularities to form predictions that guide our perceptions and actions. The goal of such active "predictive sensing" is to selectively enhance the processing and representation of behaviorally relevant information in an efficient manner. Since a hallmark of schizophrenia is impaired information selection, we tested whether this deficiency stems from dysfunctional predictive sensing by measuring the degree to which neuronal activity predicts relevant events. In healthy subjects, we established that these mechanisms are engaged in an effort-dependent manner and that, based on a correspondence between human scalp and intracranial nonhuman primate recordings, their main role is a predictive suppression of excitability in task-irrelevant regions. In contrast, schizophrenia patients displayed a reduced alignment of neuronal activity to attended stimuli, which correlated with their behavioral performance deficits and clinical symptoms. These results support the relevance of predictive sensing for normal and aberrant brain function, and highlight the importance of neuronal mechanisms that mold internal ongoing neuronal activity to model key features of the external environment.


Figures

Figure 1.
Figure 1.
Trial number-related bias in ITC. Traces show averaged ITC values related to 1000 random draws of 50–250 phase values, which were measured at 0.67 Hz at stimulus onset, and were pooled across all controls and patients in the three different task conditions. Lines across the ITC traces mark the average number of trials in each condition. Note that even though ITC values change as a function of the number of trials, the differences among conditions are persistent.
Figure 2.
Figure 2.
Task-dependent entrainment of low-frequency neuronal oscillations and their relationship to high-frequency neuronal activity. A, Surface auditory ERP waveforms from frontocentral electrode location FCz in response to standard tones in controls and patients. The EEG data were filtered in the 3–55 Hz frequency band to eliminate the low-frequency baseline fluctuation apparent in the waveforms displayed. Boxplots show that the amplitude of the N1 peak is the same across conditions within subject groups and significantly smaller in patients versus controls. Repeated-measures ANOVA revealed a highly significant main effect of group (F(1,58) = 18.4, p < 0.0001). Color map insets demonstrate the averaged topographical distribution of the N1 component over the scalp. B, Same surface ERP waveforms from frontocentral electrode FCz as in A, but data were not filtered, and ERPs are displayed on a longer time scale. In controls (n = 20), an oscillatory baseline fluctuation appears during the easy frequency discrimination task (green trace), which becomes more prominent during the performance of the more difficult frequency discrimination (dark blue trace). As opposed to this, a baseline fluctuation is just noticeable in patients (n = 40) and does not show the same task dependence. Boxplots to the left display delta (0.67 Hz) ITC at stimulus onset in passive and attentive conditions. It is apparent that the delta ITC of patients does not show any significant task-related changes. Map insets demonstrate the distribution of delta ITC across the scalp during the performance of the difficult task. C, Averaged time–frequency maps of single-trial neuroelectric activity in passive and individualized attention conditions. The amplitude of activity >13 Hz was multiplied by 1.3 for better visibility. As the boxplots to the right show as well, narrow-band delta (0.6–0.8 Hz, marked by the arrows) amplitude does not change significantly across conditions. Nonetheless, there is a significant attention-related amplitude increase in the alpha band in both controls and patients. Also note that in controls but not patients oscillations in the beta/gamma bands exhibit task structure-related amplitude fluctuations. D, Averaged (15–50 Hz) beta/gamma amplitude waveforms reveal that while there is no stimulus structure-related gamma amplitude modulation in the passive condition, gamma amplitude fluctuates rhythmically in the active condition in controls. While the overall level of gamma oscillatory activity is the same in patients, they lack gamma amplitude modulation. Boxplots to the right display the pooled difference of peristimulus (−100 to 100 ms, designated by “2”) and interstimulus (−900 to −700 ms, designated by “1”) gamma amplitudes to quantify this observation. Map insets illustrate the scalp distribution of the beta/gamma modulation index during the performance of the difficult task.
Figure 3.
Figure 3.
Topographic distribution of task-related beta/gamma amplitude modulation. The scalp distribution maps of beta/gamma modulation amplitudes in three sub-bands show that the location of maximal task structure-related modulation is characteristically different in control subjects (top). Patients show substantially lower amplitude modulation in all sub-bands, with somewhat different scalp topographies.
Figure 4.
Figure 4.
The sequential modulation of low-frequency neuronal activity. A, Frontocentral average ERPs of controls (n = 19) recorded in the difficult (top) and easy (bottom) task conditions. Only trials where five or more standards (S1–S5) followed a deviant were used. The data of one subject had to be eliminated because of <10 trials following artifact rejection. The dotted traces show the ERP waveforms filtered in the 0.5–1 Hz delta range. Bar plot below illustrates the sequential probability of a deviant in stimulus positions 1–5 following a deviant without (red) and with taking the number of previous standards into account (purple). B, Averaged ERP amplitude in the −50 to 0 ms prestimulus time interval preceding sequential standard stimuli following a deviant stimulus. C, Pooled (n = 19) delta (0.67 Hz) ITC measured at the onset of standard stimuli in positions 1–5 following a deviant stimulus. Error bars denote SE.
Figure 5.
Figure 5.
Theta and alpha band neuronal activity in controls and patients. A, Spectrogram of neuronal activity recorded at frontocentral electrode FCz, measured in single trials in the −1000 to −200 ms prestimulus time interval. Light and dark blue traces are averaged spectrograms of controls in passive and individualized attention conditions respectively, while purple and red traces are averaged spectrograms from the same conditions in patients. Dotted arrows to the left mark the frequency that corresponds to the stimulation rate and its first harmonic. During the performance of the auditory task, both subject groups show somewhat increased delta amplitude at these frequencies. Nonetheless, this amplitude increase is not significant, when measured either around the peak or in the entire delta band (see Results). The prominent attention-related changes in the spectrum occur in the theta/alpha bands. As the spectrograms illustrate, the 7 Hz peak in the passive condition “shifts” to 9 Hz in the attentive condition in both groups, due to an amplitude increase of neuronal activity in the alpha band. B, Topographic maps of neuronal activity at the 7 Hz theta peak in the passive condition in controls and patients indicate that at least part of the measured theta activity most likely originates in auditory cortical regions. It is also apparent that the amplitude of theta frequency band neuronal activity is larger in patients. C, Comparing the amplitude of theta (7 Hz) oscillatory activity in the passive condition in controls versus patients at FCz revealed a just significant difference (Wilcoxon rank sum, p = 0.046). D, As opposed to the distribution of theta band activity in the passive condition, the attention-related amplitude increase in the theta/alpha bands (7–11 Hz) apparent in the spectrograms (see A) maps mostly to parietal and parieto-occipital regions. E, Boxplots of pooled alpha amplitude increase over parietal electrodes (averaged across PZ, P1, P2, P3, and P4) show that it does not differ in the two subject groups (Wilcoxon rank sum test, p > 0.01).
Figure 6.
Figure 6.
Delta entrainment to attended auditory stimuli in intracranial recordings. A, Averaged ERP waveforms related to attended auditory stimuli recorded intracranially just above primary auditory cortex in a macaque monkey. While the orange trace is the average of recordings above A1 regions whose BF corresponded to the frequency of the attended tones (n = 10), the green trace is the average of concurrent recordings from a second electrode positioned above an area that was not tuned to the frequency of attended tones (non-BF). The rhythmic delta range baseline fluctuation is in opposite phase above non-BF compared with BF regions even recorded only 2 mm apart. Black tick marks on the x-axis denote the times when stimuli were presented. B, Gamma amplitude traces on top illustrate that there is a stimulus structure-related fluctuation of gamma activity that is also opposite in sign. MUA traces on the bottom show a similar trend. Note that the amplitude of the baseline MUA modulation is very small, since it reflects subthreshold excitability changes, as opposed to the MUA responses to tones reflecting suprathreshold activation and consequent firing of the neuronal ensemble. C, The first boxplot quantifies the gamma amplitude modulation: the difference of prestimulus and interstimulus gamma amplitudes is positive above BF regions signaling increasing gamma oscillatory activity in the immediate prestimulus time interval. As opposed to this, it is negative above non-BF regions, similar to human surface data. The second boxplot displays the amplitude of intracortical MUA modulation (prestimulus − interstimulus MUA), which shows the same trend. D, The distribution of mean delta phase across human subjects (top) and monkey recording sites (bottom) at the time attended auditory stimuli are presented. In controls, mean delta phases are pooled around the negative peak, while in patients the distribution of mean delta phases appears more random, even across subjects with significant delta phase bias (Rayleigh test, p < 0.05, 13 of 40 subjects; only these mean phases are displayed). In monkey intracranial recordings, mean delta phases are pooled around the positive peak above A1 sites that are tuned to the attended frequency (i.e., BF). In contrast, mean delta phases are pooled around the negative peak above A1 sites tuned to different frequencies (i.e., non-BF), similar to the mean delta phase of control subjects recorded on the scalp.
Figure 7.
Figure 7.
Correlation of delta ITC with pitch discrimination ability and P3 in control subjects and schizophrenia patients. A, Linear regression plot of delta ITC at stimulus onset versus tone discrimination ability in controls and patients. Pearson's linear correlation coefficients and the significance of correlations are displayed in green. The linear regression of control and patient data are displayed by dotted lines (controls: r = −0.30, p = 0.08; patients: r = −0.55, p = 0.001). B, Similar to above, delta ITC was derived from analysis of responses to standard stimuli that followed or preceded the deviants by at least two stimulus positions (see Materials and Methods). P3 amplitudes were extracted from responses to deviant stimuli using previously described methods (Leitman et al., 2010). Delta ITC correlated significantly with P3 amplitude both across groups and in patients alone. The linear fit of control and patient data are displayed by dotted lines (controls: r = 0.11 p = 0.63; patients: r = 0.35, p = 0.036).

Similar articles

Cited by

References

    1. Adrian ED, Matthews BH. The interpretation of potential waves in the cortex. J Physiol. 1934;81:440–471. - PMC - PubMed
    1. Baldeweg T. Repetition effects to sounds: evidence for predictive coding in the auditory system. Trends Cogn Sci. 2006;10:93–94. doi: 10.1016/j.tics.2006.01.010. - DOI - PubMed
    1. Bäss P, Jacobsen T, Schröger E. Suppression of the auditory N1 event-related potential component with unpredictable self-initiated tones: evidence for internal forward models with dynamic stimulation. Int J Psychophysiol. 2008;70:137–143. doi: 10.1016/j.ijpsycho.2008.06.005. - DOI - PubMed
    1. Bastos AM, Usrey WM, Adams RA, Mangun GR, Fries P, Friston KJ. Canonical microcircuits for predictive coding. Neuron. 2012;76:695–711. doi: 10.1016/j.neuron.2012.10.038. - DOI - PMC - PubMed
    1. Besle J, Schevon CA, Mehta AD, Lakatos P, Goodman RR, McKhann GM, Emerson RG, Schroeder CE. Tuning of the human neocortex to the temporal dynamics of attended events. J Neurosci. 2011;31:3176–3185. doi: 10.1523/JNEUROSCI.4518-10.2011. - DOI - PMC - PubMed

Publication types