. 2013 Jul 10;33(28):11724-33.
doi: 10.1523/JNEUROSCI.2196-12.2013.

Response selectivity is correlated to dendritic structure in parvalbumin-expressing inhibitory neurons in visual cortex

Affiliations

Response selectivity is correlated to dendritic structure in parvalbumin-expressing inhibitory neurons in visual cortex

Caroline A Runyan et al. J Neurosci. .

Abstract

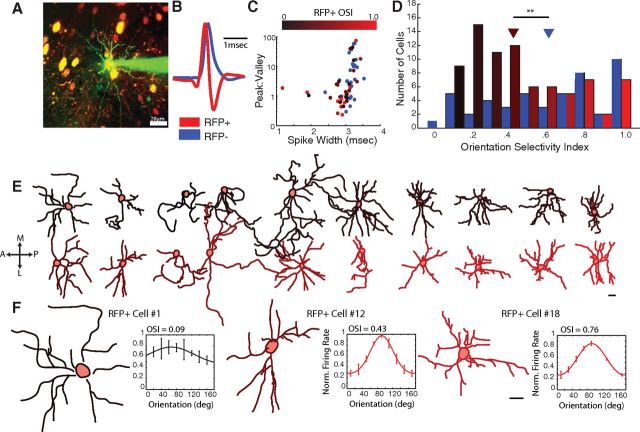
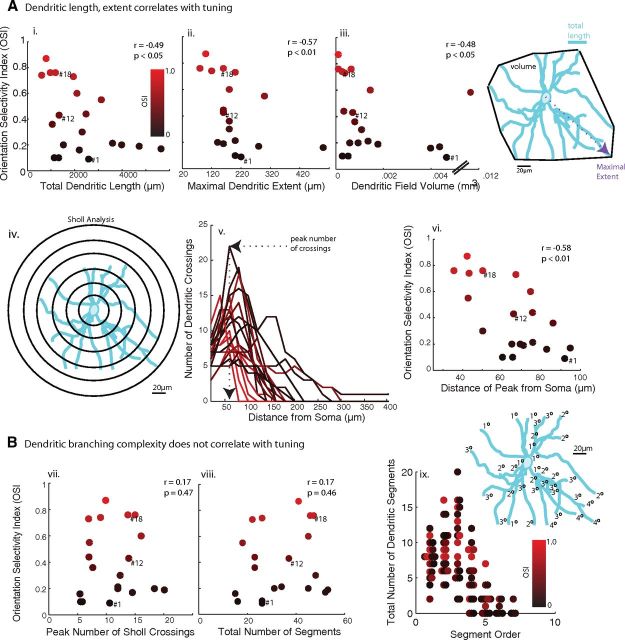
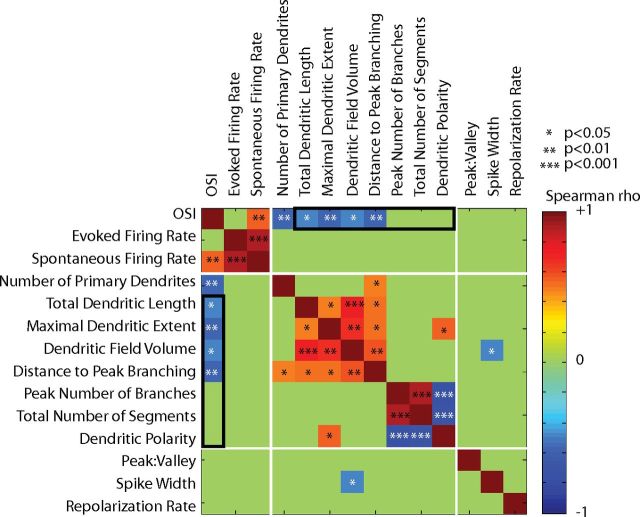
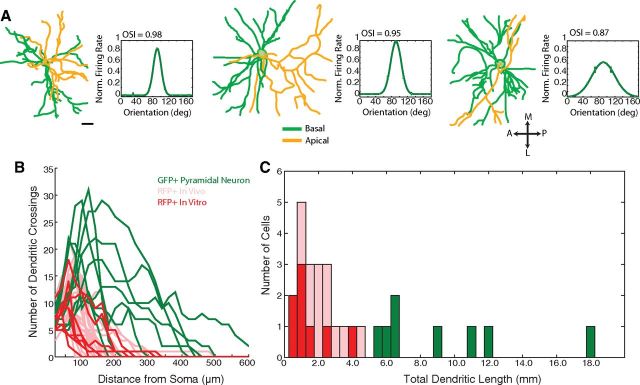
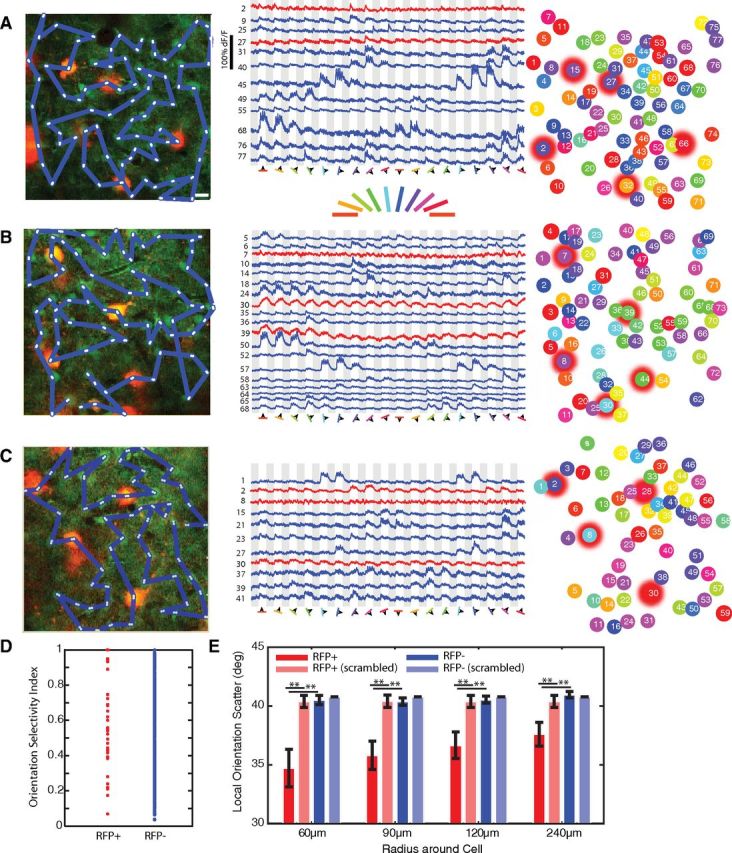
Inhibitory neurons have been shown to perform a variety of functions within brain circuits, including shaping response functions in target cells. Still, how the properties of specific inhibitory neuron classes relate to their local circuits remains unclear. To better understand the distribution and origins of orientation selectivity in inhibitory neurons expressing the calcium binding protein parvalbumin (PV) in the mouse primary visual cortex, we labeled PV(+) neurons with red fluorescent protein (RFP) and targeted them for cell-attached electrophysiological recordings. PV(+) neurons could be broadly tuned or sharply tuned for orientation but tended to be more broadly tuned than unlabeled neurons on average. The dendritic morphology of PV(+) cells, revealed by intracellular labeling, was strongly correlated with tuning: highly tuned PV(+) neurons had shorter dendrites that branched nearer to the soma and had smaller dendritic fields overall, whereas broadly tuned PV(+) neurons had longer dendrites that branched farther from the soma, producing larger dendritic fields. High-speed two-photon calcium imaging of visual responses showed that the orientation preferences of highly tuned PV(+) neurons resembled the preferred orientations of neighboring cells. These results suggest that the diversity of the local neighborhood and the nature of dendritic sampling may both contribute to the response selectivity of PV(+) neurons.


Figures

Figure 1.
Figure 1.
Relating structure and function in PV+ neurons in vivo. A, The orientation selectivity of RFP+ neurons and RFP neurons was characterized in the primary visual cortex of PV-Cre mice injected with a floxed-RFP viral construct. RFP+ neurons were targeted for recording under two-photon guidance, with a patch pipette containing green dye (Alexa-488). Each cell was then electroporated with the dye, and a z-stack was collected through the extent of the dendritic tree to enable morphological reconstruction. Scale bar, 20 μm. B, Spikes recorded from RFP+ neurons (red) and RFP neurons (blue) were averaged and normalized by their maximum voltage. Spikes recorded from the RFP+ neurons showed the characteristic shape of fast-spiking PV+ neurons, including a strong afterhyperpolarization. C, The spike shapes of RFP+ neurons and RFP neurons were distinguishable by the ratio of peak to valley amplitude and spike width. RFP+ neurons are color-coded by their OSI, demonstrating that spike shape in RFP+ neurons did not predict orientation selectivity (p > 0.3). D, The histogram of OSIs of RFP+ (red, shaded by OSI) and RFP (blue) neurons reveals a wide range of orientation selectivity in both RFP+ and RFP neurons, although RFP+ neurons tended to be more broadly tuned than RFP neurons on average (p < 0.01). E, Twenty RFP+ neurons were reconstructed (see Materials and Methods), flattened through the z-plane (dorsal-ventral) for illustration purposes only, and color-coded by OSI as in C–D. All neurons are oriented similarly, as if in a tangential section. A, Anterior; P, posterior; M, medial; L, lateral. F, Three representative examples across the OSI range are shown, along with their orientation tuning curves. Error bars on tuning curves indicate SEM. Cell numbers indicate the cell IDs from Table 1. Scale bars: E, F, 20 μm. **p < 0.01.
Figure 2.
Figure 2.
Dendritic extent, but not dendritic complexity, correlates with orientation selectivity of PV+ neurons. A, All four measures of dendritic extent were significantly correlated with the OSI of RFP+ neurons: i, The total dendritic length, the sum of the lengths of all dendrites; ii, the maximal dendritic extent, the distance of the most distal dendritic tip from the soma; iii, the dendritic field volume, the convex volume enclosed by the 3D coordinates of the neuron's tips; iv–vi, the distance of the Sholl peak from the soma were used to assess the spatial spread of dendritic integration by RFP+ neurons. B, Dendritic complexity, assessed by the peak number of Sholl crossings (vii; illustrated in iv, v), the total number of dendritic segments (viii), and the number of higher-order dendritic segments (ix), did not significantly correlate with OSI. Data points corresponding to the example cells of Figure 2 are indicated by their ID numbers.
Figure 3.
Figure 3.
Correlations between all measured response properties, morphology, and spike shape parameters in the 20 reconstructed RFP+ neurons of Figures 1 and 2. The color of each cell in the matrix corresponds to the Spearman correlation coefficient between the pair of parameters, according to the color bar at right, ranging from −1 (dark blue) to +1 (red). Coefficients with p values >0.05 have been set to 0 (green). *p < 0.05. The comparisons between OSI and morphological features described in Figure 2 are outlined in black, indicating the negative correlation between OSI and dendritic extent and lack of correlation between OSI and dendritic complexity. Three other clustered sets of related parameters show significant correlations, as expected: (1) firing rates, (2) measures of dendritic extent, and (3) measures of dendritic complexity. *p < 0.05, **p < 0.01, ***p < 0.001.
Figure 4.
Figure 4.
Control dendritic reconstructions of pyramidal neurons in vivo, RFP+/PV+ neurons in vitro, and comparison with in vivo reconstructions of RFP+/ PV+ neurons showing similar representations of full dendritic morphologies. A, For comparison, pyramidal neurons from the Thy1-GFPS mouse line were reconstructed. Reconstructions of three example pyramidal neurons are presented as in Figure 1E–F, with apical processes colored in yellow and basal processes in green. Scale bar, 20 μm. B, Dendritic morphology is similar in RFP+ neurons reconstructed in vivo and in vitro, and distinct from GFP+ pyramidal neurons. The Sholl profiles of the RFP+ PV+ neurons imaged in vitro (bold red) and GFP+ pyramidal neurons imaged in vivo are superimposed on the in vivo RFP+ data from Figure 2 (pink). The in vitro Sholl profiles overlap extensively with the in vivo RFP+ Sholl profiles. Peak number of crossings (p = 0.28), distance of the peak from the soma (p = 0.22), and radius (p = 0.39) of the Sholl profiles were statistically similar in the in vitro and in vivo imaged cells, and distinct from pyramidal neurons (p < 0.001). C, Histogram of the total dendritic length of GFP+ pyramidal neurons (green), RFP+ neurons imaged in vitro (red), and RFP+ neurons imaged in vivo (pink). The total dendritic length was statistically similar (p = 0.30) between the two sets of RFP+ cells; however, both groups of RFP+ neurons had shorter dendrites than the GFP+ pyramidal neurons (p < 0.001). The morphological similarity between reconstructions of RFP+ neurons in vivo and in vitro suggests that in vivo imaging fully captured the dendritic arbors of these neurons.
Figure 5.
Figure 5.
RFP+ neurons tend to share the orientation preferences of their neighbors. A–C, Left column, RFP+ neurons (red) and surrounding RFP neurons were loaded with the calcium dye Oregon Green Bapta-1AM (green). Three representative networks are shown. The blue lines indicate the scan paths used to image calcium responses. White asterisks indicate the first and last pixels from which each cell's fluorescence response was collected within the scan path. Scale bar, 10 μm. Middle column, Example fluorescent responses to the 18 episodically presented drifting gratings (18 directions; gray represents 4 s OFF; white represents 4 s ON), from cells in each of the example networks (blue represents RFP neuron responses; red represents RFP+ neuron responses). Right column, Each neuron is color-coded by its preferred orientation, and RFP+ neurons are indicated by red halos. A, RFP+ OSIs: cell #2, 0.23; #15, 0.84; #27, 0.80; #32, 0.29; #66, 0.48. B, RFP+ OSIs: cell #7, 0.92; #8, 0.6; #30, 0.32; #39, 0.59; #44, 0.38. C, RFP+ OSIs: cell #2, 0.74; #8, 0.31; #28, 0.51; #30, 0.35. D, The OSI spanned the full range from 0 (untuned) to 1 (highly tuned) in both RFP+ (red) and RFP (blue) neurons, consistent with the electrophysiology measurements of Figure 1. E, The local scatter in orientation preference surrounding each neuron within expanding intercell distances (red represents RFP+ neurons; pink, RFP+ in same networks with scrambled orientation preferences; dark blue, RFP neurons; light blue, RFP in same networks with scrambled orientation preferences). The scatter surrounding RFP+ neurons was significantly lower than the scatter surrounding RFP neurons (p < 0.01), or RFP+ neurons in scrambled networks (p < 0.01). Error bars indicate SEM. **p < 0.01.

Similar articles

Cited by

References

    1. Adesnik H, Bruns W, Taniguchi H, Huang ZJ, Scanziani M. A neural circuit for spatial summation in visual cortex. Nature. 2012;490:226–231. doi: 10.1038/nature11526. - DOI - PMC - PubMed
    1. Atallah BV, Bruns W, Carandini M, Scanziani M. Parvalbumin-expressing interneurons linearly transform cortical responses to visual stimuli. Neuron. 2012;73:159–170. doi: 10.1016/j.neuron.2011.12.013. - DOI - PMC - PubMed
    1. Blatow M, Rozov A, Katona I, Hormuzdi SG, Meyer AH, Whittington MA, Caputi A, Monyer H. A novel network of multipolar bursting interneurons generates θ frequency oscillations in neocortex. Neuron. 2003;38:805–817. doi: 10.1016/S0896-6273(03)00300-3. - DOI - PubMed
    1. Bock DD, Lee WC, Kerlin AM, Andermann ML, Hood G, Wetzel AW, Yurgenson S, Soucy ER, Kim HS, Reid RC. Network anatomy and in vivo physiology of visual cortical neurons. Nature. 2011;471:177–182. doi: 10.1038/nature09802. - DOI - PMC - PubMed
    1. Brainard DH. The psychophysics toolbox. Spat Vis. 1997;10:433–436. - PubMed

Publication types

LinkOut - more resources