. 2013 Sep;163(1):150-60.
doi: 10.1104/pp.113.221234. Epub 2013 Jul 10.

The endocytosis of cellulose synthase in Arabidopsis is dependent on μ2, a clathrin-mediated endocytosis adaptin

Affiliations

The endocytosis of cellulose synthase in Arabidopsis is dependent on μ2, a clathrin-mediated endocytosis adaptin

Logan Bashline et al. Plant Physiol. 2013 Sep.

Abstract

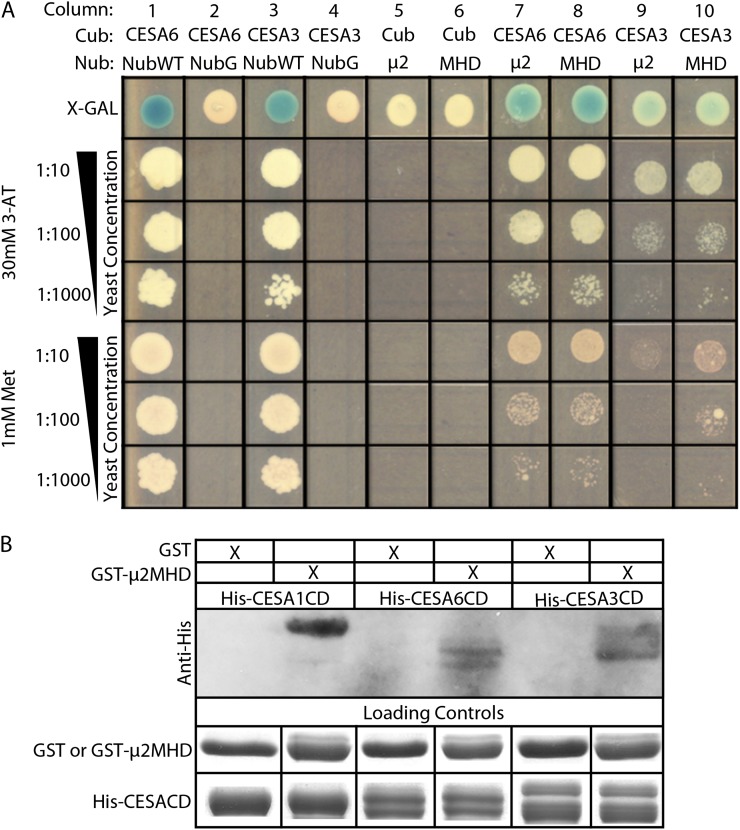
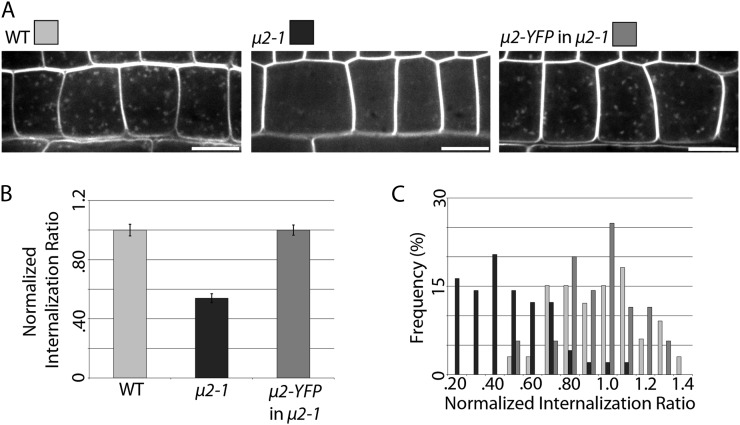
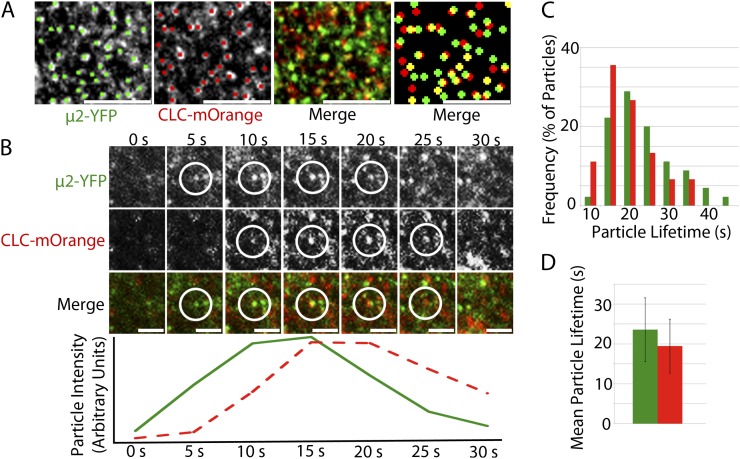
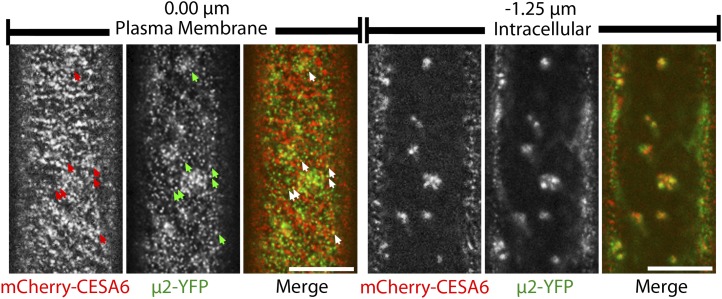
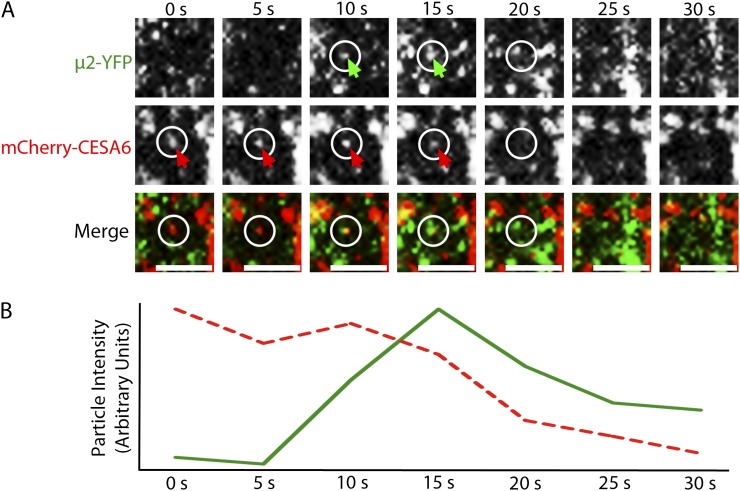
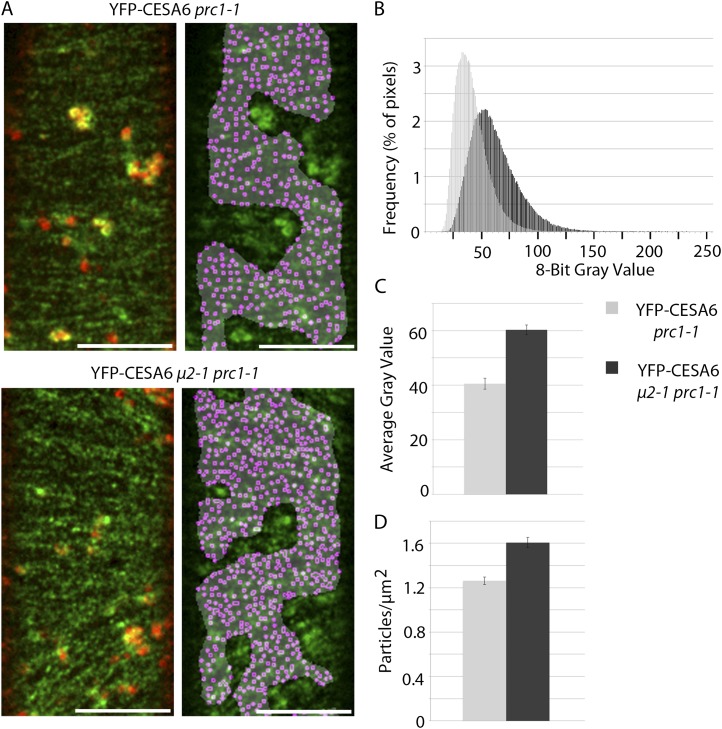
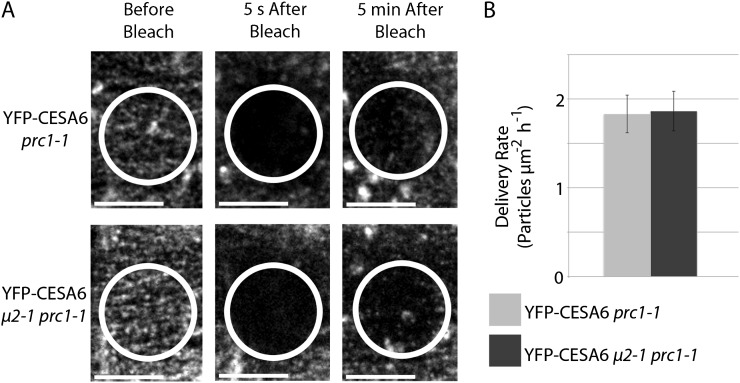
Clathrin-mediated endocytosis (CME) is the best-characterized type of endocytosis in eukaryotic cells. Plants appear to possess all of the molecular components necessary to carry out CME; however, functional characterization of the components is still in its infancy. A yeast two-hybrid screen identified μ2 as a putative interaction partner of CELLULOSE SYNTHASE6 (CESA6). Arabidopsis (Arabidopsis thaliana) μ2 is homologous to the medium subunit 2 of the mammalian ADAPTOR PROTEIN COMPLEX2 (AP2). In mammals, the AP2 complex acts as the central hub of CME by docking to the plasma membrane while concomitantly recruiting cargo proteins, clathrin triskelia, and accessory proteins to the sites of endocytosis. We confirmed that μ2 interacts with multiple CESA proteins through the μ-homology domain of μ2, which is involved in specific interactions with endocytic cargo proteins in mammals. Consistent with its role in mediating the endocytosis of cargos at the plasma membrane, μ2-YELLOW FLUORESCENT PROTEIN localized to transient foci at the plasma membrane, and loss of μ2 resulted in defects in bulk endocytosis. Furthermore, loss of μ2 led to increased accumulation of YELLOW FLUORESCENT PROTEIN-CESA6 particles at the plasma membrane. Our results suggest that CESA represents a new class of CME cargo proteins and that plant cells might regulate cellulose synthesis by controlling the abundance of active CESA complexes at the plasma membrane through CME.


Figures

Figure 1.
Figure 1.
μ2 interacts with primary CESAs through the μ-homology domain. A, SU-Y2H analysis shows a positive interaction between μ2 and both CESA3 and CESA6. Interactions were selected on Leu-, Trp-, and His-dropout medium with 1.0 mm Met or 30 mm 3-ammonium-triazole (3-AT). 5-Bromo-4-chloro-3-indolyl-β-d-galactopyranoside (X-Gal) was added for the detection of β-galactosidase activity. Yeast strains were cotransformed with a Cub vector and a Nub vector. Cub vectors consisted of CESA6-Cub-PLV, CESA3-Cub-PLV, or Cub-PLV alone as a negative control. Nub vectors consisted of μ2-NubG or μ2MHD-NubG as experimental constructs and NubWT alone and NubG alone as positive and negative controls, respectively. B, μ2MHD interacts with the central domain of CESA1, CESA3, and CESA6 in vitro. His-CESA1CD, His-CESA3CD, and His-CESA6CD all coprecipitated with GST-μ2MHD. GST alone did not pull down His-CESA1CD, His-CESA3CD, or His-CESA6CD.
Figure 2.
Figure 2.
The μ2-1 mutant has a defect in endocytosis that can be complemented by μ2-YFP. A, Intracellular FM4-64 puncta were imaged after 8.5 min of exposure to 2 μm FM4-64 in epidermal root cells in wild-type (WT), μ2-1, and μ2-YFP μ2-1 seedlings. Bars = 10 μm. B, FM4-64 internalization was quantified (see “Materials and Methods”) and normalized to the wild type (n = 33 cells, 16 seedlings for the wild type, 49 cells, 19 seedlings for μ2-1, and 35 cells, 12 seedlings for μ2-YFP μ2-1; P < 0.0001). Error bars represent se. C, A histogram shows the distribution of FM4-64 internalization ratios.
Figure 3.
Figure 3.
μ2-YFP and CLC-mOrange puncta colocalize and exhibit transient behavior at the plasma membrane with similar temporal behavior. A, Single-frame images show colocalization between μ2-YFP and CLC-mOrange particles at the plasma membrane. Manual particle selection was used to enhance the detection of colocalized particles. The left merge image displays two signals without manual particle selection, while the right merge image displays enlarged manually selected particles. Bars = 5 μm. B, Colocalized μ2-YFP and CLC-mOrange particles appear and disappear together at the plasma membrane. The fluorescence intensity profiles of the μ2-YFP (green trace) and CLC-mOrange (red dashed trace) are displayed in arbitrary units below the images for each time point. Shown is one representative instance chosen from more than 100 documented events. C, A histogram shows the distribution of μ2-YFP and CLC-mOrange particle lifetimes at the plasma membrane. D, Mean lifetime of μ2-YFP and CLC-mOrange particles (n = 45 particles for each μ2-YFP and CLC-mOrange). Error bars represent sd.
Figure 4.
Figure 4.
μ2-YFP and mCherry-CESA6 have overlapping distributions in planta. Confocal optical sections show epidermal cells of a 3-d-old etiolated hypocotyl coexpressing mCherry-CESA6 and μ2-YFP. mCherry-CESA6 and μ2-YFP puncta are visible at the plasma membrane (left) and in intracellular compartments (right). Arrows indicate examples of colocalized particles at the plasma membrane. Intracellular images were obtained at a focal plane that is 0.75 to 1.25 μm below the plasma membrane. Bars = 10 μm.
Figure 5.
Figure 5.
Plasma membrane-localized mCherry-CESA6 and μ2-YFP particles transiently colocalize before disappearing together. A, A time series of images shows the appearance of a μ2-YFP particle at the same position as an mCherry-CESA6 particle and the subsequent codisappearance of the particles at the 20-s frame. Arrows indicate μ2-YFP and mCherry-CESA6 particles. At the 20-s frame, circles mark the positions from which the particles disappeared. A μ2-YFP particle that forms above the position of the internalization event remains visible in subsequent frames, indicating that the focal plane is stable. Bars = 2 μm. B, Fluorescence intensity profiles of mCherry-CESA6 (red dashed trace) and μ2-YFP (green trace) particles are displayed in arbitrary units and show an association between the transient appearance and disappearance of the μ2-YFP particle and the diminishment of the mCherry-CESA6 particle intensity. Shown is one representative instance of a dozen documented events.
Figure 6.
Figure 6.
The μ2-1 mutant has a higher density of CESAs at the plasma membrane. A, Representative images of the plasma membrane-localized YFP-CESA6 particles in μ2-1 prc1-1 and the prc1-1 control. Merged images between the plasma membrane (green) and intracellular (red) focal planes indicate the locations of intracellular compartments underlying the plasma membrane (left). A gray mask indicates the ROI lacking underlying intracellular compartments, and magenta dots indicate local maxima of the fluorescence signal (right). Bars = 10 μm. B to D, Quantification of YFP-CESA6 at the plasma membrane in μ2-1 prc1-1 (dark gray bars) and prc1-1 (light gray bars) genetic backgrounds. A histogram of the distribution of grayscale values of YFP-CESA6 signal (B), a graph of the mean grayscale value of YFP-CESA6 signal (C), and a graph of the average density of YFP-CESA6 particles (D) are shown (n = 11 cells from nine seedlings for μ2-1 prc1-1 and 13 cells from 11 seedlings for prc1-1; P < 0.0001). Error bars represent se.
Figure 7.
Figure 7.
The delivery rate of YFP-CESA6 is similar in μ2-1 prc1-1 and the prc1-1 control. A, Representative images show the repopulation of the plasma membrane with YFP-CESA6 particles during the 5 min after the photobleaching of a ROI. Large signals from intracellular YFP-CESA6 that transiently passed through the ROI were not scored in the quantification of delivery. Bars = 10 μm. B, The quantification of the delivery rate shows no significant difference in the delivery of YFP-CESA6 in μ2-1 prc1-1 (dark gray bar) and prc1-1 (light gray bar) backgrounds (n = 5 seedlings for each μ2-1 prc1-1 and prc1-1). Error bars represent sd.

References

    1. Alonso JM, Stepanova AN, Leisse TJ, Kim CJ, Chen HM, Shinn P, Stevenson DK, Zimmerman J, Barajas P, Cheuk R, et al. (2003) Genome-wide insertional mutagenesis of Arabidopsis thaliana. Science 301: 653–657 - PubMed
    1. Baluska F, Hlavacka A, Samaj J, Palme K, Robinson DG, Matoh T, McCurdy DW, Menzel D, Volkmann D. (2002) F-actin-dependent endocytosis of cell wall pectins in meristematic root cells: insights from brefeldin A-induced compartments. Plant Physiol 130: 422–431 - PMC - PubMed
    1. Baluska F, Liners F, Hlavacka A, Schlicht M, Van Cutsem P, McCurdy DW, Menzel D. (2005) Cell wall pectins and xyloglucans are internalized into dividing root cells and accumulate within cell plates during cytokinesis. Protoplasma 225: 141–155 - PubMed
    1. Bandmann V, Homann U. (2012) Clathrin-independent endocytosis contributes to uptake of glucose into BY-2 protoplasts. Plant J 70: 578–584 - PubMed
    1. Beck M, Zhou J, Faulkner C, MacLean D, Robatzek S. (2012) Spatio-temporal cellular dynamics of the Arabidopsis flagellin receptor reveal activation status-dependent endosomal sorting. Plant Cell 24: 4205–4219 - PMC - PubMed

Publication types

MeSH terms