. 2013 Sep 15;126(Pt 18):4121-35.
doi: 10.1242/jcs.121988. Epub 2013 Jul 10.

Rac1 is deactivated at integrin activation sites through an IQGAP1-filamin-A-RacGAP1 pathway

Affiliations

Rac1 is deactivated at integrin activation sites through an IQGAP1-filamin-A-RacGAP1 pathway

Guillaume Jacquemet et al. J Cell Sci. .

Abstract

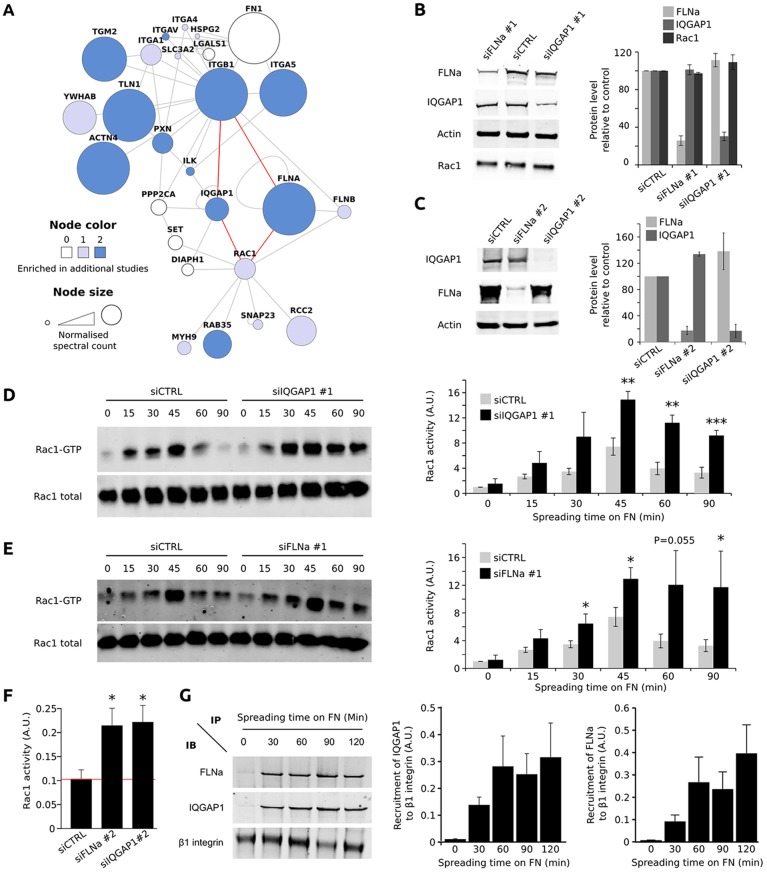
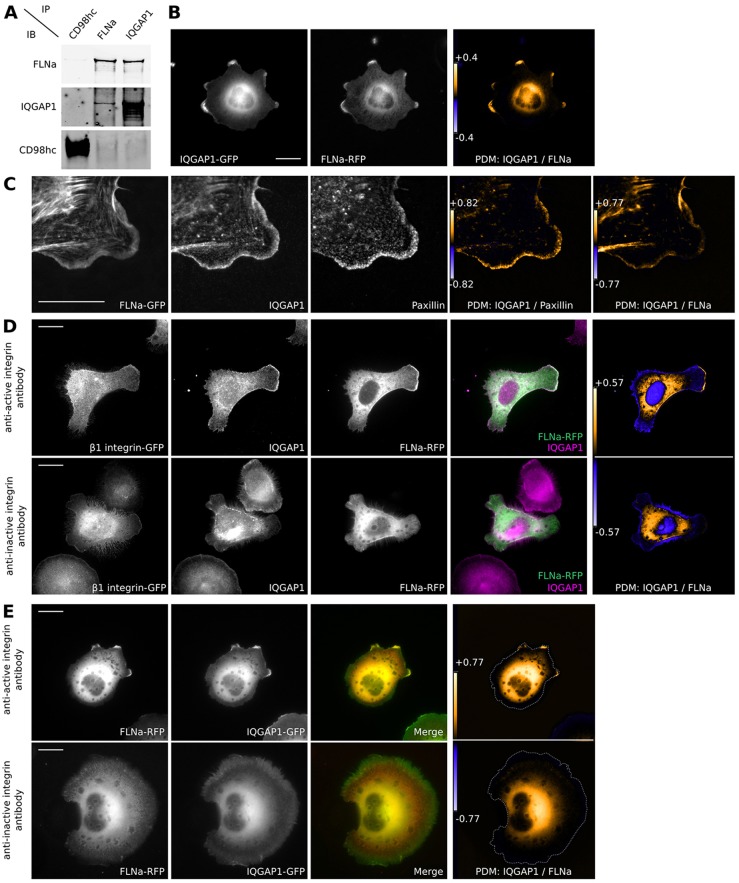
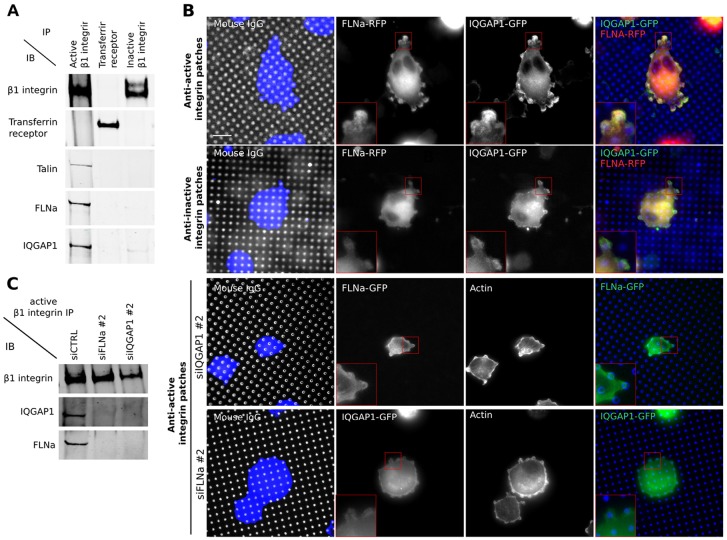
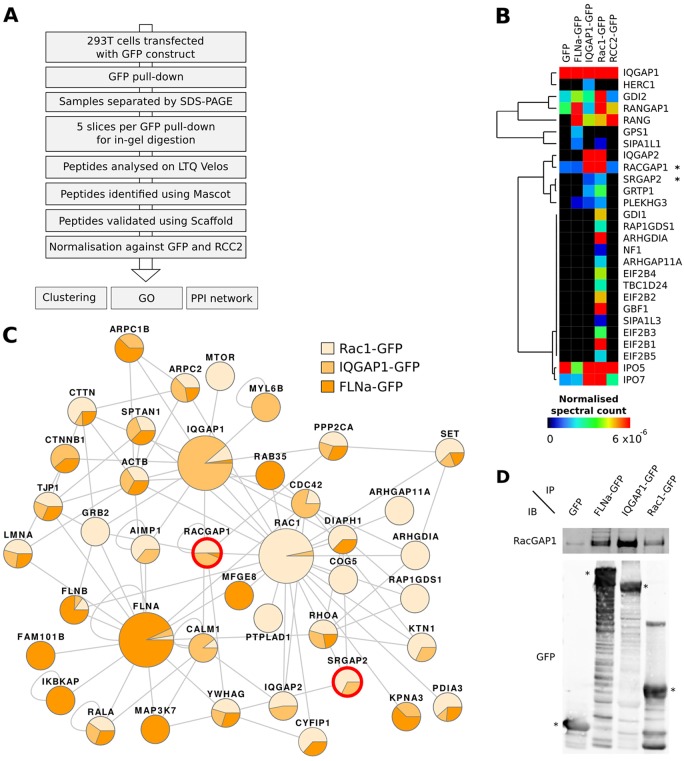
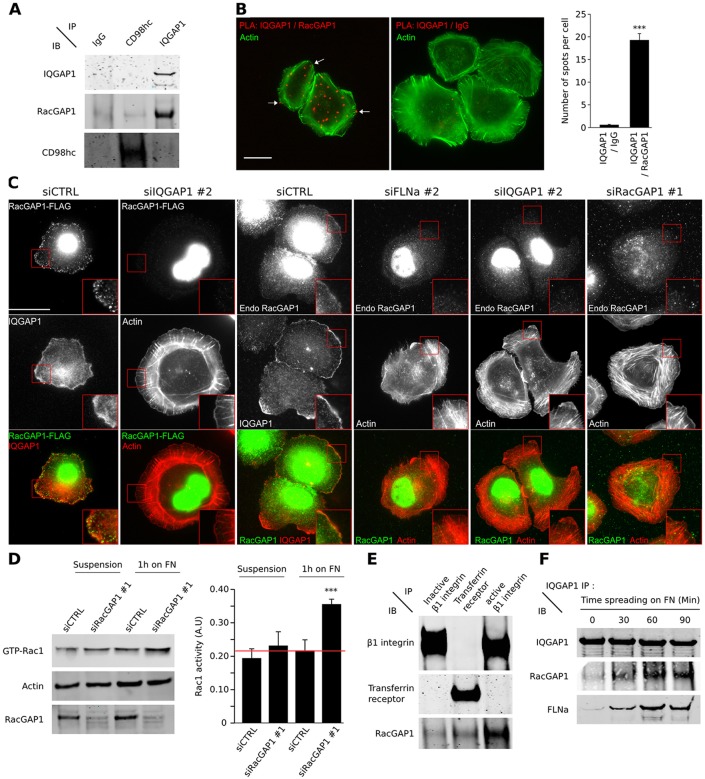
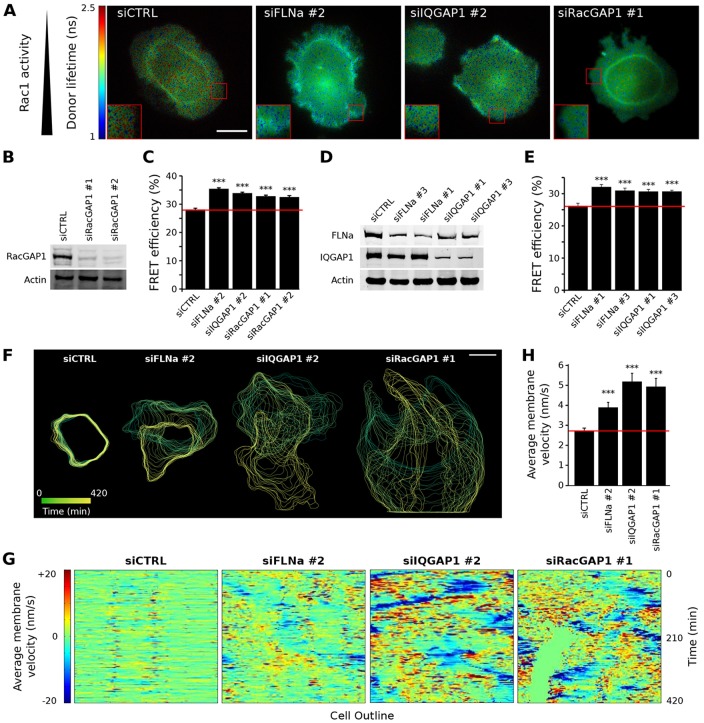
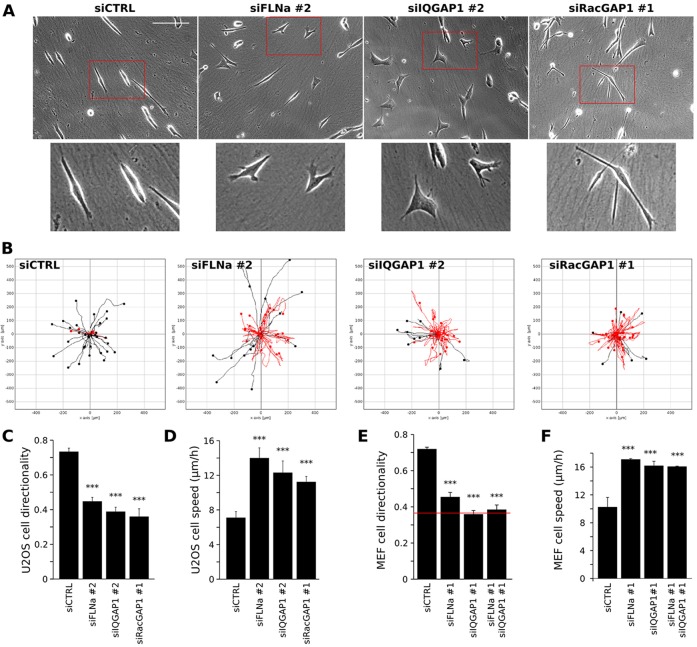
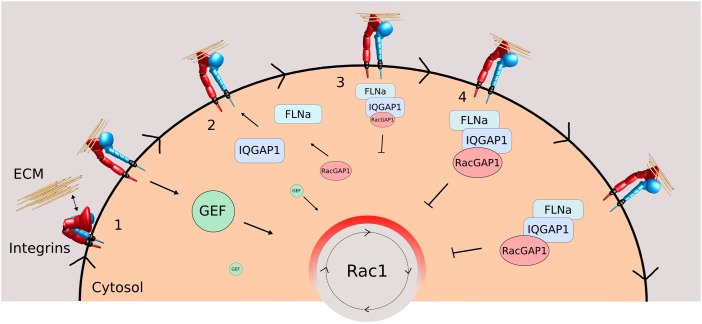
Cell migration makes a fundamental contribution to both normal physiology and disease pathogenesis. Integrin engagement with extracellular ligands spatially controls, via the cyclical activation and deactivation of the small GTPase Rac1, the dynamic membrane protrusion and cytoskeletal reorganization events that are required for directional migration. Although the pathways that control integrin-mediated Rac1 activation are reasonably well defined, the mechanisms that are responsible for switching off activity are poorly understood. Here, proteomic analysis of activated integrin-associated complexes suggests filamin-A and IQ-motif-containing GTPase-activating protein 1 (IQGAP1) as candidates that link β1 integrin to Rac1. siRNA-mediated knockdown of either filamin-A or IQGAP1 induced high, dysregulated Rac1 activity during cell spreading on fibronectin. Using immunoprecipitation and immunocytochemistry, filamin-A and IQGAP1 were shown to be part of a complex that is recruited to active β1 integrin. Mass spectrometric analysis of individual filamin-A, IQGAP1 and Rac1 pull-downs and biochemical analysis, identified RacGAP1 as a novel IQGAP1 binding partner. Further immunoprecipitation and immunocytochemistry analyses demonstrated that RacGAP1 is recruited to IQGAP1 and active β1 integrin, and that suppression of RacGAP1 expression triggered elevated Rac1 activity during spreading on fibronectin. Consistent with these findings, reduced expression of filamin-A, IQGAP1 or RacGAP1 triggered unconstrained membrane protrusion and disrupted directional cell migration on fibrillar extracellular matrices. These findings suggest a model whereby integrin engagement, followed by filamin-A, IQGAP1 and RacGAP1 recruitment, deactivates Rac1 to constrain its activity spatially and thereby coordinate directional cell migration.

Keywords: FLNa; IQGAP1; Integrin; Migration; Rac1; RacGAP1.


Figures

Fig. 1.
Fig. 1.
FLNa and IQGAP1 suppress integrin-mediated Rac1 activation. (A) The network of FN-induced adhesion complexes that connect β1 integrin to Rac1. Proteins identified in FN-induced adhesion complexes (Humphries et al., 2009) were mapped onto a literature-curated PPI network (see the Materials and Methods for details). Each node (circle) represents a protein (labelled with gene name) and each edge (line) represents a reported interaction between two proteins. Node colour indicates whether a particular protein was also identified by Kuo et al. (Kuo et al., 2011) and/or Schiller et al. (Schiller et al., 2011). Node area is proportional to the normalised spectral count of the proteins identified by Humphries et al. (Humphries et al., 2009). Reported direct binders of β1 integrin and Rac1 are displayed, and red edges highlight selected putative links between β1 integrin and Rac1. To allow a clear visualisation of the connection between β1 integrin and Rac1, nodes of this network were manually organised. (B–F) To study the role of FLNa and IQGAP1 in Rac1 activation, MEFs (B) and U2OS cells (C) were treated with control oligonucleotide (siCTRL) or siRNA targeting FLNa or IQGAP1, and Rac1 activity was measured using an effector pull-down approach (D–F). (D,E) Rac1 activation level in MEFs was measured during cell spreading on FN and Rac1 activity was normalised to that of siCTRL cells kept in suspension (siFLNa #1 n = 6; siIQGAP1 #1 n = 4). (F) Rac1 activation levels in U2OS cells, knocked down for FLNa or IQGAP1 was measured after 1 hour of spreading on FN (n = 4). (G) Quantification of FLNa and IQGAP1 recruitment to β1 integrin during cell spreading on FN. For each time point, total β1 integrin was immunoprecipitated from HFF cell lysates using the pan-β1-integrin antibody K20 and analysed by western blotting (n = 4). The kinetics of FLNa and IQGAP1 recruitment to β1 integrin were normalised to the amount of β1 integrin. Error bars represent s.e.m. (*P<0.05; **P<0.01; ***P<0.005). AU, arbitrary unit; IB, immunoblot; IP, immunoprecipitation.
Fig. 2.
Fig. 2.
FLNa and IQGAP1 form a complex. (A) Co-association of FLNa and IQGAP1 was assessed by immunoprecipitation from HFF cell lysates following spreading on FN (n = 3). (B) Co-localisation of FLNa and IQGAP1 was determined by fluorescence microscopy in U2OS cells expressing IQGAP1–GFP and FLNa–RFP, plated on FN for 2 hours. PDM (product of the differences from the mean) images were created by calculating and displaying the PDM value for each pixel, where PDM = (red intensity−mean red intensity)×(green intensity−mean green intensity). (C) Co-localisation of FLNa, IQGAP1 and paxillin was determined by fluorescence microscopy in 3T3 cells expressing FLNa–GFP, plated on FN for 2 hours. (D,E) Subcellular localisation of FLNa and IQGAP1 was analysed in human β1-integrin–GFP-expressing MEFs (D) transiently expressing FLNa–RFP and in U2OS cells (E) transiently expressing IQGAP1–GFP and FLNa–RFP, plated on anti-β1 integrin monoclonal antibodies that induce different integrin activation states (12G10, active; 4B4, inactive). Images are representative of all cells plated on anti-integrin antibodies. Scale bars: 10 µm (C); 20 µm (B,E); 25 µm (D).
Fig. 3.
Fig. 3.
FLNa and IQGAP1 are recruited to active integrins. (A) β1 integrin was immunoprecipitated from HFF cell lysates using activation-state-specific anti-β1-integrin antibodies (9EG7, active; mAb13, inactive) and anti-transferrin-receptor antibody (OKT9) as a negative control (n = 4). (B) U2OS cells transiently expressing FLNa–RFP and IQGAP1–GFP were plated on anti-β1-integrin antibody-coated patches (12G10, active; 4B4, inactive), and U2OS cells transiently expressing FLNa–GFP or IQGAP1–GFP and knocked down for either FLNa or IQGAP1 were plated on 12G10 patches. (C) The recruitment of FLNa and IQGAP1 to active β1 integrins was assessed by immunoprecipitation using 9EG7 from U2OS cells, in which either FLNa or IQGAP1 was knocked down. IB, immunoblot; IP, immunoprecipitation. Scale bar: 10 µm.
Fig. 4.
Fig. 4.
MS analysis of FLNa-, IQGAP1- and Rac1-associated proteins. (A) Work-flow used to identify new FLNa, IQGAP1 and Rac1 binding partners. (B) Hierarchical clustering of proteins annotated with the Gene Ontology term ‘GTPase regulator activity’ identified by mass spectrometry in GFP, FLNa–GFP, IQGAP1–GFP and RCC2–GFP pull-downs. Known Rac1 GAPs are highlighted with asterisks. (C) Organic representation of the sub-network connecting FLNa, IQGAP1 and Rac1. The proteins identified by mass spectrometric analysis of the FLNa–GFP, IQGAP1–GFP and Rac1–GFP pull-downs were mapped onto a literature-based PPI network. Nodes are displayed as pie charts illustrating the relative abundance of each protein in each respective pull-down. Larger nodes represent the three bait proteins, and red node borders highlight known Rac1 GAPs. Nodes of this network were automatically organised using an algorithm that clusters nodes as a function of their connectivity. (D) Co-purification of RacGAP1 with IQGAP1–GFP was tested by western blot analysis of GFP pull-downs performed in 293T cells transiently expressing GFP, FLNa–GFP, IQGAP1–GFP or Rac1–GFP. Asterisks represent the positions of each of the GFP-tagged proteins.
Fig. 5.
Fig. 5.
RacGAP1 is recruited to IQGAP1 to suppress Rac1 activity. (A) Co-purification of endogenous IQGAP1 and RacGAP1 was assessed by immunoprecipitation in U2OS cells plated on FN. (B) Direct association between endogenous IQGAP1 and endogenous RacGAP1 was assessed by proximity ligation assay (PLA) in U2OS cells plated on FN for 1 hour. PLAs were quantified by counting the number of positive spots per cell using ImageJ (PLA IQGAP1/RacGAP1 n = 70; PLA IQGAP1/IgG n = 79). Arrows highlight the positive spots at the cell periphery. (C) Subcellular location of RacGAP1 (endogenous or RacGAP1–FLAG) and IQGAP1 was analysed in siCTRL-, siFLNa-, siIQGAP1- or siRacGAP1-treated U2OS cells plated on FN for 1 hour. (D) Rac1 activation levels in RacGAP1 siRNA-treated U2OS cells spread on FN for 1 hour or kept in suspension were measured by effector pull-down and analysed by western blotting (n = 5). Error bars represent s.e.m. (***P<0.005). (E) The recruitment of RacGAP1 to β1 integrin was assessed by immunoprecipitation from HFF cell lysates using activation-state-specific anti-β1-integrin antibodies (9EG7, active; mAb13, inactive) and anti-transferrin-receptor antibody (OKT9) as a negative control. (F) The kinetics of FLNa and RacGAP1 recruitment to IQGAP1 were assessed by immunoprecipitation in U2OS cells during cell spreading on FN. IB, immunoblot; IP, immunoprecipitation; PLA, proximity ligation assay. Scale bars: 20 µm (B); 25 µm (C).
Fig. 6.
Fig. 6.
FLNa, IQGAP1 and RacGAP1 regulate Rac1 activity and membrane protrusion dynamics. (A–E) Activation state of Rac1 was monitored using the Rac1-Raichu probe in U2OS cells (A–C) and 3T3 cells (D,E), pre-treated with control oligonucleotide (siCTRL) or siRNA targeting FLNa (siFLNa #1 and #3 in 3T3 cells; siFLNa #2 in U2OS cells), IQGAP1 (siIQGAP1 #1 and 3 in 3T3 cells; siIQGAP1 #2 in U2OS cells) or RacGAP1 (siRacGAP1 #1 and #2 in U2OS cells), plated on FN for 1 hour. Rac1 activity was quantified by measuring the average donor lifetime of the Raichu probe across the whole cell (low lifetime, high activity; high lifetime, low activity) using FLIM/FRET (U2OS cells, siCTRL n = 73, siIQGAP1 #2 n = 63, siFLNa #2 n = 63, siRacGAP1 #1 n = 58, siRacGAP1 #2 n = 47; 3T3 cells, siCTRL n = 25, siIQGAP1 #1 n = 27, siIQGAP1 #3 n = 22, siFLNa #1 n = 30, siFLNa #3 n = 31). (C,E) FRET efficiency was calculated as described in the Materials and Methods. (F-H) U2OS cells transiently expressing Lifeact-mEGFP were transfected with siCTRL, siFLNa, siIQGAP1 or siRacGAP1 and plated on FN for 4 hours. Cells were imaged for 420 minutes at 1 frame every 180 seconds. For each time point, cell outlines were segmented into 400 nodes connected by edges using QuimP11, and the velocity of each node was calculated. For each condition, the time projection (F) and motility map (G) of the cell outlines were plotted. Positive motility values (red) represent areas of membrane protrusion, whereas negative motility values (blue) represent areas of membrane retraction. (H) The overall membrane dynamics were calculated as the mean motility of the cell outline over the recording period in siCTRL (n = 34), siFLNa (n = 27), siIQGAP1 (n = 22) and siRacGAP1 (n = 19) cells. Error bars represent s.e.m. (***P<0.005). Scale bars: 20 µm (A,F).
Fig. 7.
Fig. 7.
FLNa, IQGAP1 and RacGAP1 regulate directional cell migration. (A–D) U2OS cells transfected with siCTRL, siFLNa, siIQGAP1 or siRacGAP1 were plated on CDMs for 4 hours and their migration recorded for 16 hours and manually tracked. (A) Representative fields demonstrating the morphology of the cells on CDMs. Red boxes delineate inset areas. For each condition, spider plots (40 cell tracks; red tracks highlight cells with directionality below 0.5) were created (B), and cell directionality (C) and cell speed (D) were analysed (n = 3). (E,F) MEFs transfected with siCTRL, siFLNa, siIQGAP1 or siFLNa/siIQGAP1 were plated on CDM for 4 hours and their migration recorded for 16 hours. For each condition, cell directionality (E) and cell speed (F) were analysed (n = 3). Error bars represent s.e.m. (***P<0.005). Scale bar: 20 µm.
Fig. 8.
Fig. 8.
Recruitment of FLNa, IQGAP1 and RacGAP1 to active β1 integrin regulates Rac1 activity. Scheme representing a cycle of sequential integrin-mediated signalling events regulating Rac1 activation. Integrin–ECM engagement triggers an increase in Rac1 activity, most likely via the recruitment of a GEF (1). Rac1 activity levels increase to a maximum, and FLNa and IQGAP1 are recruited (2 and 3). FLNa and IQGAP1 recruit RacGAP1 to suppress Rac1 activity (3 and 4). Rac1 activation level is represented by a red gradient around its edge. Hypothetical activation and protein level of GEFs and GAPs are represented by the size of their nodes.

References

    1. Askari J. A., Buckley P. A., Mould A. P., Humphries M. J. (2009). Linking integrin conformation to function. J. Cell Sci. 122, 165–170 10.1242/jcs.018556 - DOI - PMC - PubMed
    1. Askari J. A., Tynan C. J., Webb S. E. D., Martin-Fernandez M. L., Ballestrem C., Humphries M. J. (2010). Focal adhesions are sites of integrin extension. J. Cell Biol. 188, 891–903 10.1083/jcb.200907174 - DOI - PMC - PubMed
    1. Awasthi A., Samarakoon A., Chu H., Kamalakannan R., Quilliam L. A., Chrzanowska-Wodnicka M., White G. C., 2nd, Malarkannan S. (2010). Rap1b facilitates NK cell functions via IQGAP1-mediated signalosomes. J. Exp. Med. 207, 1923–1938 10.1084/jem.20100040 - DOI - PMC - PubMed
    1. Baldassarre M., Razinia Z., Burande C. F., Lamsoul I., Lutz P. G., Calderwood D. A. (2009). Filamins regulate cell spreading and initiation of cell migration. PLoS ONE 4, e7830 10.1371/journal.pone.0007830 - DOI - PMC - PubMed
    1. Barsnes H., Vizcaíno J. A., Eidhammer I., Martens L. (2009). PRIDE Converter: making proteomics data-sharing easy. Nat. Biotechnol. 27, 598–599 10.1038/nbt0709-598 - DOI - PubMed

Publication types