. 2013 Jun 20:7:167-92.
doi: 10.4137/BBI.S11509. Print 2013.

A modular cell-type focused inflammatory process network model for non-diseased pulmonary tissue

Affiliations

A modular cell-type focused inflammatory process network model for non-diseased pulmonary tissue

Jurjen W Westra et al. Bioinform Biol Insights. .

Abstract

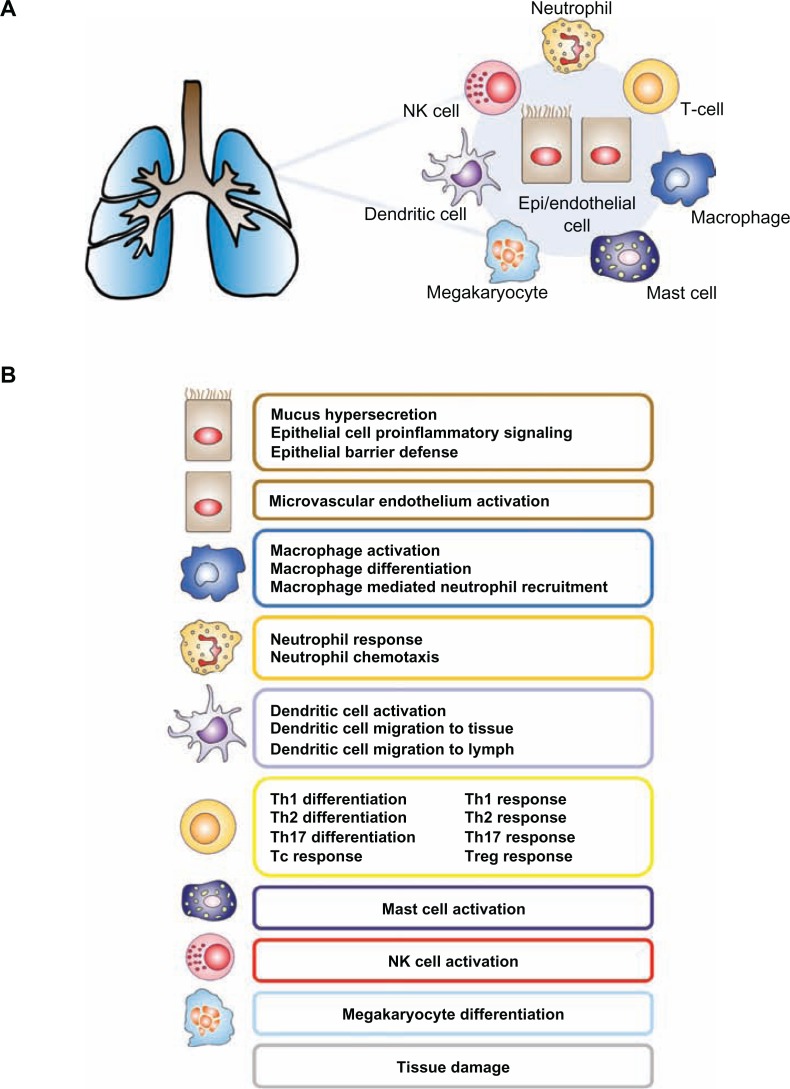
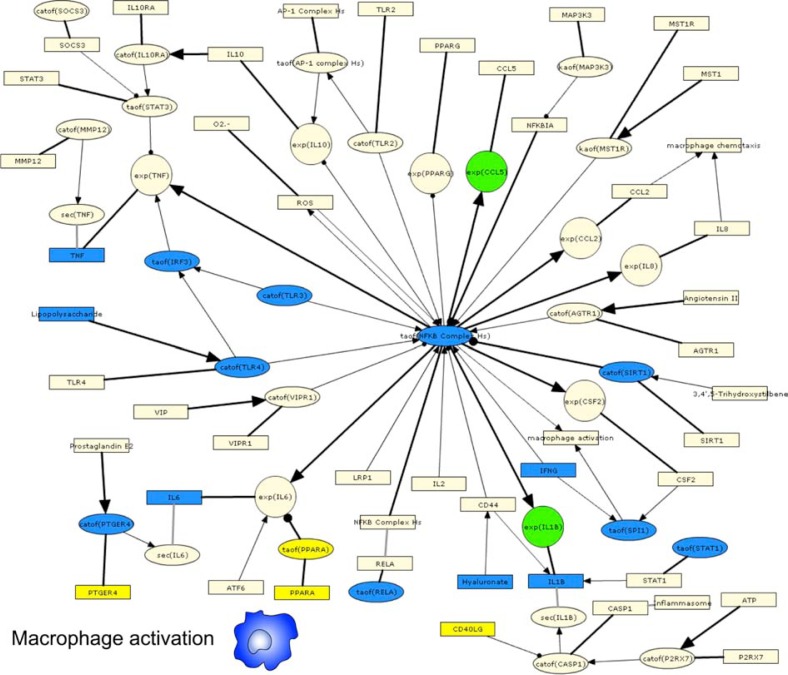
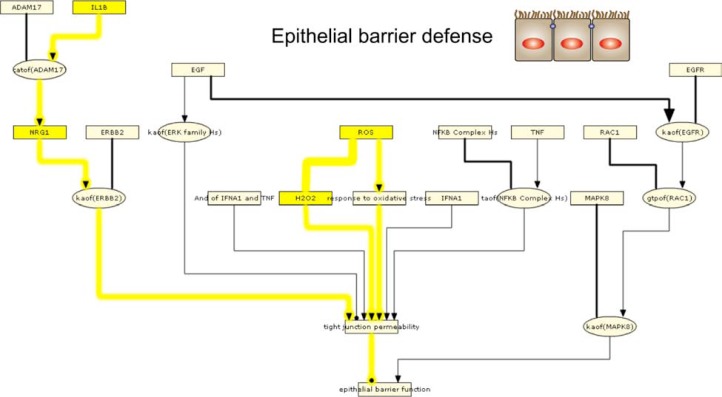
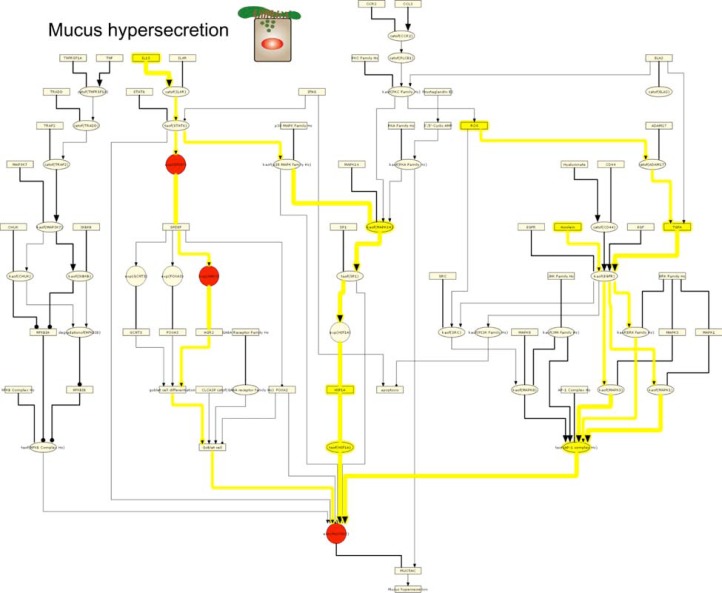
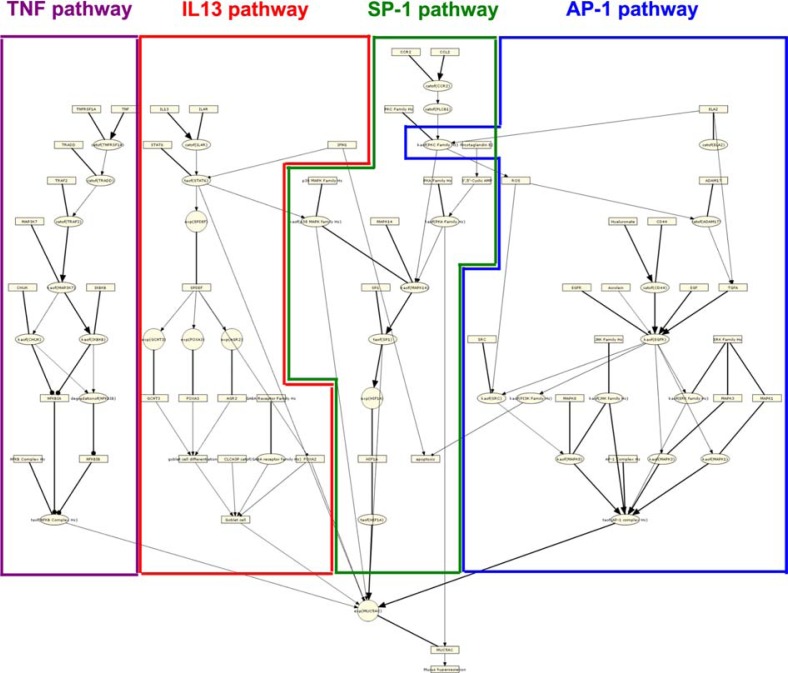
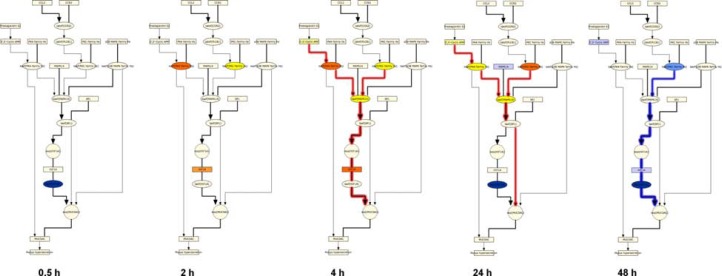
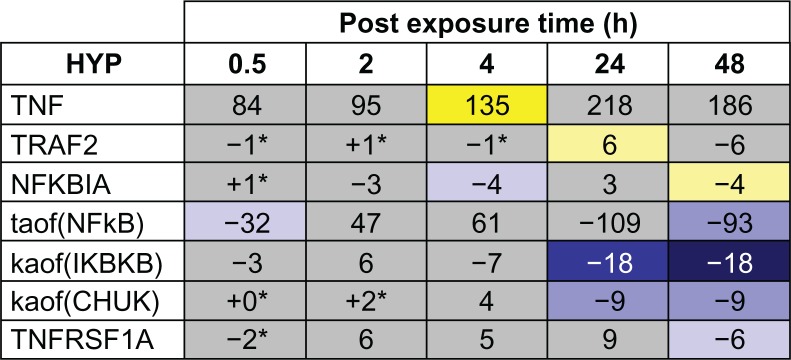
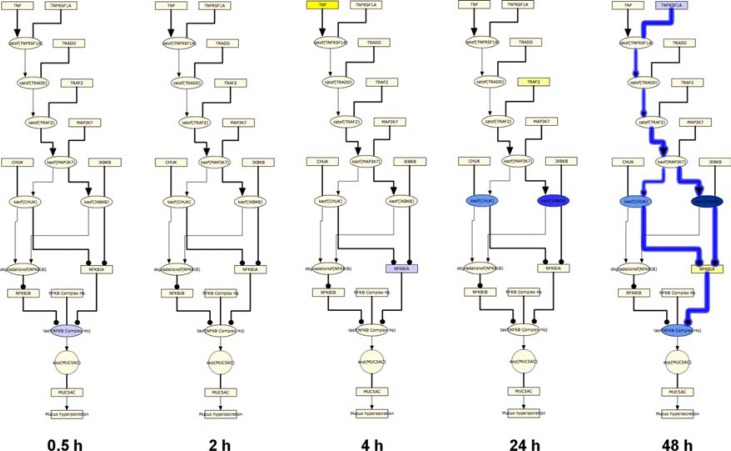
Exposure to environmental stressors such as cigarette smoke (CS) elicits a variety of biological responses in humans, including the induction of inflammatory responses. These responses are especially pronounced in the lung, where pulmonary cells sit at the interface between the body's internal and external environments. We combined a literature survey with a computational analysis of multiple transcriptomic data sets to construct a computable causal network model (the Inflammatory Process Network (IPN)) of the main pulmonary inflammatory processes. The IPN model predicted decreased epithelial cell barrier defenses and increased mucus hypersecretion in human bronchial epithelial cells, and an attenuated pro-inflammatory (M1) profile in alveolar macrophages following exposure to CS, consistent with prior results. The IPN provides a comprehensive framework of experimentally supported pathways related to CS-induced pulmonary inflammation. The IPN is freely available to the scientific community as a resource with broad applicability to study the pathogenesis of pulmonary disease.

Keywords: biological expression language (BEL); cigarette smoke; gene expression; inflammation; network model; reverse causal reasoning (RCR).


Figures

Figure 1
Figure 1
IPN model overview—(A) The IPN model is designed to capture the inflammation related signaling in response to CS. Its constituent submodels represent the signaling that occurs in the main cell types involved in CS-induced pulmonary inflammation, including epithelial cells and macrophages. (B) Functional modularity was introduced into the IPN by the construction of 23 submodels.
Figure 2
Figure 2
IPN model investigation of CS-exposed alveolar macrophages. Notes: HYPs from analysis of GSE13896 are colored based on whether they were predicted increased (yellow) or decreased (blue). Gene expression State Changes are colored according to their observed change of increased (red) or decreased (green). A high resolution model image, is available in Supplemental Figure 2.
Figure 3
Figure 3
IPN model investigation of CS-exposed epithelial cell barrier defense. Notes: HYPs from analysis of GSE994 are colored based on whether they were predicted increased (yellow) or decreased (blue). Gene expression State Changes are colored according to their observed change of increased (red) or decreased (green). The pathways discussed in the text are likewise highlighted based on whether they support the same outputs. HYPs and edges that support increased pathways are shown in yellow lines while decreased pathways are shown in blue lines. A high resolution model image is available in Supplemental Figures 3 and 4.
Figure 4
Figure 4
IPN model investigation of CS-exposed epithelial cell mucus hypersecretion. Notes: HYPs from analysis of GSE994 are colored based on whether they were predicted increased (yellow) or decreased (blue). Gene expression State Changes are colored according to their observed change of increased (red) or decreased (green). The pathways discussed in the text are likewise highlighted based on whether they support the same outputs. HYPs and edges that support increased pathways are shown in yellow lines while decreased pathways are shown in blue lines. A high resolution model image is available in Supplemental Figure 6.
Figure 5
Figure 5
Pathway detail for the IPN: Mucus Hypersecretion model. Notes: The Mucus Hypersecretion model contains signaling detail from four main pathways known to induce airway MUC5AC production. The TNF pathway (purple) includes the TNFR ligands TNF and TNFRSF1A and culminates in the transcriptional activation of NFkB. The IL13 pathway (red), describes the molecular events leading to epithelial cell differentiation into mucin-producing goblet cells through the cytokine IL13 and the transcription factor, SPDEF. The SP-1 pathway (green) describes the routes leading to transcriptional activation of MUC5AC by the transcription factor SP-1, and includes the upstream signaling kinases, PKA, PKC and MAPK14. The AP-1 pathway (blue) includes the primary pathways that activate MUC5AC expression via EGFR activation and the signaling intermediate, reactive oxygen species (ROS).
Figure 6
Figure 6
Temporal activation of AP-1 mediated MUC5AC production following acute CS exposure. Notes: The results of RCR analysis on E-MTAB-874 in the AP-1 pathway of the Mucus Hypersecretion model. Fourteen of the AP-1 pathway nodes were predicted as a HYP in one more of the recovery time points. The heat map is color coded according to the HYP concordance P-values, where yellow-orange shades indicate inferred increases in abundance or activity and blue shades indicate inferred decreases in abundance or activity. Lower P-values for concordance are indicated by darker shades. The numerical label indicates the number of State Changes supporting each prediction. Cells with an asterisk (*) indicate HYPs where the P-value for richness was not met, despite a passing P-value for concordance. A full description can be found in Supplemental File 3.
Figure 7
Figure 7
Temporal activation of AP-1 mediated MUC5AC production following acute CS exposure. Notes: HYPs and State Changes from the RCR analysis of E-MTAB-874 mapped to the AP-1 pathway of the Mucus Hypersecretion model. The model is color coded according to the HYP concordance P-values, where yellow-orange shades indicate inferred increases in abundance or activity and blue shades indicate inferred decreases in abundance or activity. Lower P-values for concordance are indicated by darker shades. Gene expression State Changes are colored according to their observed change of increased (red) or decreased (green). Red lines indicate activated pathways while blue lines indicated pathways that are suppressed.
Figure 8
Figure 8
Temporal activation of SP-1 mediated MUC5AC production following acute CS exposure. Notes: E-MTAB-874 in the SP-1 pathway of the Mucus Hypersecretion model. Seven of the SP-1 pathway nodes were predicted as a HYP in one more of the recovery time points. The heat map is color-coded according to the HYP concordance P-values, where yellow-orange shades indicate inferred increases in abundance or activity and blue shades indicate inferred decreases in abundance or activity. Lower P-values for concordance are indicated by darker shades. The numerical label indicates the number of State Changes supporting each prediction. Cells with an asterisk (*) indicate HYPs where the P-value for richness was not met, despite a passing P-value for concordance. A full description can be found in Supplemental File 3.
Figure 9
Figure 9
Temporal activation of SP-1 mediated MUC5AC production following acute CS exposure. Notes: HYPs and State Changes from the RCR analysis of E-MTAB-874 mapped to the SP-1 pathway of the Mucus Hypersecretion model. The model is color-coded according to the HYP concordance P-values, where yellow-orange shades indicate inferred increases in abundance or activity and blue shades indicate inferred decreases in abundance or activity. Lower P-values for concordance are indicated by darker shades. Gene expression State Changes are colored according to their observed change of increased (red) or decreased (green). Red lines indicate activated pathways while blue lines indicated pathways that are suppressed.
Figure 10
Figure 10
Temporal suppression of TNF mediated MUC5AC production following acute CS exposure. Notes: The results of RCR analysis on E-MTAB-874 in the TNF pathway of the Mucus Hypersecretion model. Seven of the AP-1 pathway nodes were predicted as a HYP in one more of the recovery time points. The heat map is color-coded according to the HYP concordance P-values, where yellow-orange shades indicate inferred increases in abundance or activity and blue shades indicate inferred decreases in abundance or activity. Lower P-values for concordance are indicated by darker shades. The numerical label indicates the number of State Changes supporting each prediction. Cells with an asterisk (*) indicate HYPs where the P-value for richness was not met, despite a passing P-value for concordance. A full description can be found in Supplemental File 3.
Figure 11
Figure 11
Temporal suppression of TNF mediated MUC5AC production following acute CS exposure. Notes: HYPs and State Changes from the RCR analysis of E-MTAB-874 mapped to the TNF pathway of the Mucus Hypersecretion model. The model is color-coded according to the HYP concordance P-values, where yellow-orange shades indicate inferred increases in abundance or activity and blue shades indicate inferred decreases in abundance or activity. Lower P-values for concordance are indicated by darker shades. Gene expression State Changes are colored according to their observed change of increased (red) or decreased (green). Red lines indicate activated pathways while blue lines indicated pathways that are suppressed.

Similar articles

Cited by

References

    1. Medzhitov R. Origin and physiological roles of inflammation. Nature. 2008;454:428–35. - PubMed
    1. Smith CJ, Hansch C. The relative toxicity of compounds in mainstream cigarette smoke condensate. Food Chem Toxicol. 2000;38(7):637–46. - PubMed
    1. Smith CJ, Perfetti TA, Morton MJ, et al. The relative toxicity of substituted phenols reported in cigarette mainstream smoke. Toxicol Sci. 2002;69:265–78. - PubMed
    1. Cantin AM. Cellular response to cigarette smoke and oxidants: adapting to survive. Proc Am Thorac Soc. 2010;7:368–75. - PubMed
    1. Barnes PJ. Immunology of asthma and chronic obstructive pulmonary disease. Nat Rev Immunol. 2008;8:183–92. - PubMed

LinkOut - more resources