

Association of lifecourse socioeconomic status with chronic inflammation and type 2 diabetes risk: the Whitehall II prospective cohort study
- PMID: 23843750
- PMCID: PMC3699448
- DOI: 10.1371/journal.pmed.1001479
Association of lifecourse socioeconomic status with chronic inflammation and type 2 diabetes risk: the Whitehall II prospective cohort study
Abstract
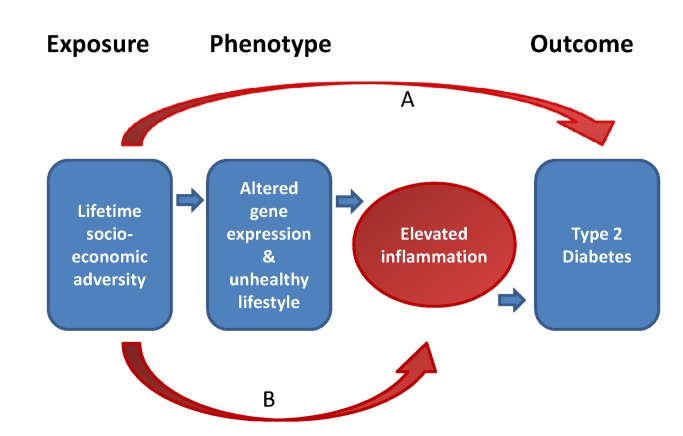
Background: Socioeconomic adversity in early life has been hypothesized to "program" a vulnerable phenotype with exaggerated inflammatory responses, so increasing the risk of developing type 2 diabetes in adulthood. The aim of this study is to test this hypothesis by assessing the extent to which the association between lifecourse socioeconomic status and type 2 diabetes incidence is explained by chronic inflammation.
Methods and findings: We use data from the British Whitehall II study, a prospective occupational cohort of adults established in 1985. The inflammatory markers C-reactive protein and interleukin-6 were measured repeatedly and type 2 diabetes incidence (new cases) was monitored over an 18-year follow-up (from 1991-1993 until 2007-2009). Our analytical sample consisted of 6,387 non-diabetic participants (1,818 women), of whom 731 (207 women) developed type 2 diabetes over the follow-up. Cumulative exposure to low socioeconomic status from childhood to middle age was associated with an increased risk of developing type 2 diabetes in adulthood (hazard ratio [HR] = 1.96, 95% confidence interval: 1.48-2.58 for low cumulative lifecourse socioeconomic score and HR = 1.55, 95% confidence interval: 1.26-1.91 for low-low socioeconomic trajectory). 25% of the excess risk associated with cumulative socioeconomic adversity across the lifecourse and 32% of the excess risk associated with low-low socioeconomic trajectory was attributable to chronically elevated inflammation (95% confidence intervals 16%-58%).
Conclusions: In the present study, chronic inflammation explained a substantial part of the association between lifecourse socioeconomic disadvantage and type 2 diabetes. Further studies should be performed to confirm these findings in population-based samples, as the Whitehall II cohort is not representative of the general population, and to examine the extent to which social inequalities attributable to chronic inflammation are reversible.
Conflict of interest statement
The authors have declared that no competing interests exist.
Figures


References
-
- Agardh E, Allebeck P, Hallqvist J, Moradi T, Sidorchuk A (2011) Type 2 diabetes incidence and socio-economic position: a systematic review and meta-analysis. Int J Epidemiol 40: 804–818. - PubMed
-
- Alberti KG, Zimmet PZ (1998) Definition, diagnosis and classification of diabetes mellitus and its complications. Part 1: diagnosis and classification of diabetes mellitus provisional report of a WHO consultation. Diabet Med 15: 539–553. - PubMed
-
- Dabelea D, Hanson RL, Lindsay RS, Pettitt DJ, Imperatore G, et al. (2000) Intrauterine exposure to diabetes conveys risks for type 2 diabetes and obesity: a study of discordant sibships. Diabetes 49: 2208–2211. - PubMed
Publication types
MeSH terms
Substances
Grants and funding
- K013351/MRC_/Medical Research Council/United Kingdom
- RG/13/2/30098/BHF_/British Heart Foundation/United Kingdom
- R01 HL036310/HL/NHLBI NIH HHS/United States
- G19/35/MRC_/Medical Research Council/United Kingdom
- G0100222/MRC_/Medical Research Council/United Kingdom
- DH_/Department of Health/United Kingdom
- R01 AG034454/AG/NIA NIH HHS/United States
- G0701830/MRC_/Medical Research Council/United Kingdom
- WT_/Wellcome Trust/United Kingdom
- G0601647/MRC_/Medical Research Council/United Kingdom
- RG/07/008/23674/BHF_/British Heart Foundation/United Kingdom
- G8802774/MRC_/Medical Research Council/United Kingdom
- G0902037/MRC_/Medical Research Council/United Kingdom
- HL36310/HL/NHLBI NIH HHS/United States
- G1000616/MRC_/Medical Research Council/United Kingdom
- R01AG034454/AG/NIA NIH HHS/United States
- R01HL036310/HL/NHLBI NIH HHS/United States
LinkOut - more resources
Full Text Sources
Other Literature Sources
Medical
Research Materials
