

Properties of immature myeloid progenitors with nitric-oxide-dependent immunosuppressive activity isolated from bone marrow of tumor-free mice
- PMID: 23843936
- PMCID: PMC3699563
- DOI: 10.1371/journal.pone.0064837
Properties of immature myeloid progenitors with nitric-oxide-dependent immunosuppressive activity isolated from bone marrow of tumor-free mice
Abstract
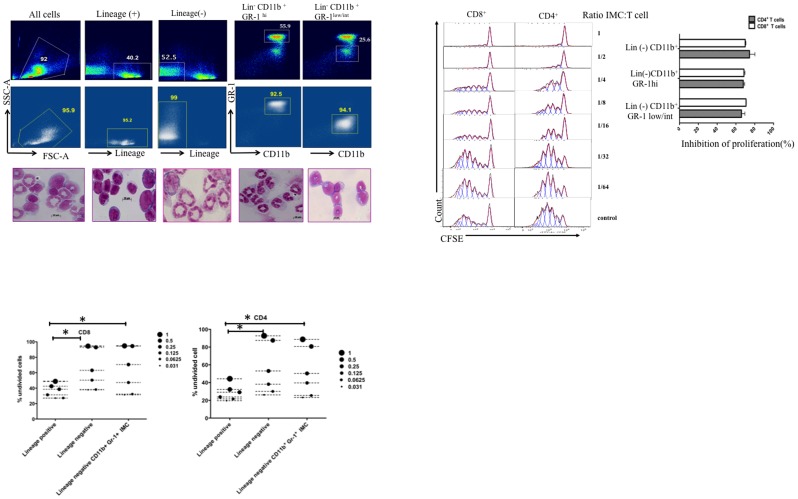
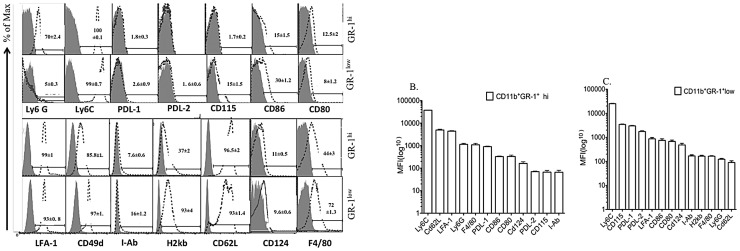
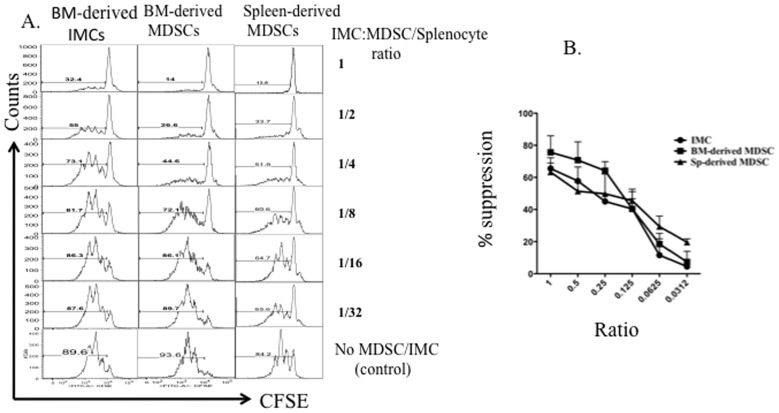
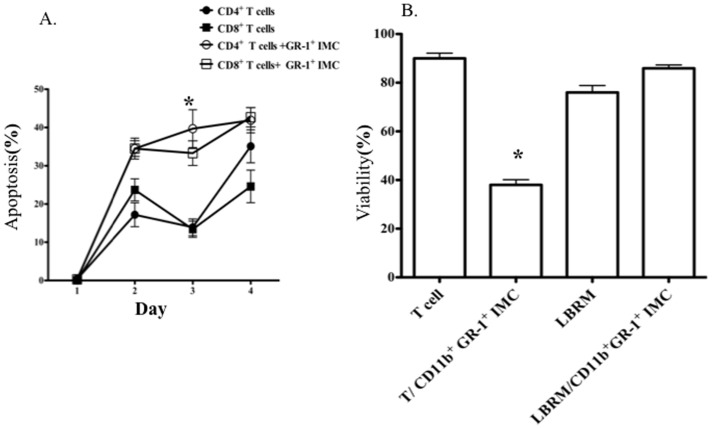
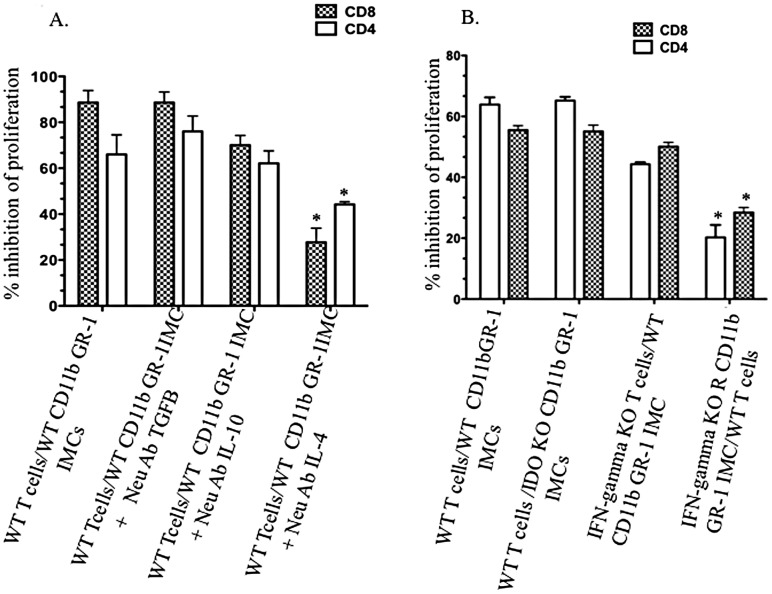
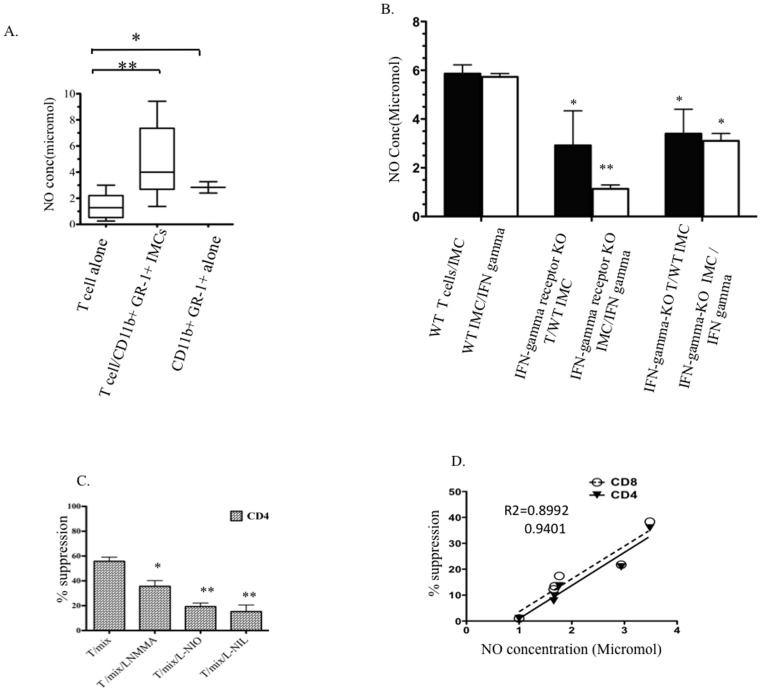
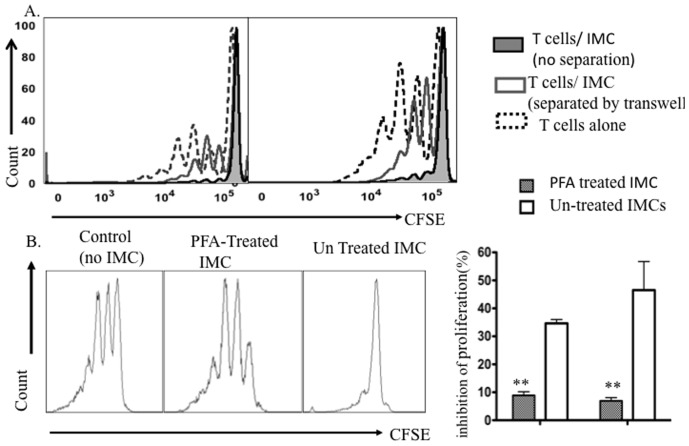
Myeloid derived suppressor cells (MDSCs) from tumor-bearing mice are important negative regulators of anti-cancer immune responses, but the role for immature myeloid cells (IMCs) in non-tumor-bearing mice in the regulation of immune responses are poorly described. We studied the immune-suppressive activity of IMCs from the bone marrow (BM) of C57Bl/6 mice and the mechanism(s) by which they inhibit T-cell activation and proliferation. IMCs, isolated from BM by high-speed FACS, inhibited mitogen-induced proliferation of CD4(+) and CD8(+) T-cells in vitro. Cell-to-cell contact of T-cells with viable IMCs was required for suppression. Neither neutralizing antibodies to TGFβ1, nor genetic disruption of indolamine 2,3-dioxygenase, abrogated IMC-mediated suppressive activity. In contrast, suppression of T-cell proliferation was absent in cultures containing IMCs from interferon-γ (IFN-γ) receptor KO mice or T-cells from IFN-γ KO mice (on the C57Bl/6 background). The addition of NO inhibitors to co-cultures of T-cells and IMC significantly reduced the suppressive activity of IMCs. IFN-γ signaling between T-cells and IMCs induced paracrine Nitric Oxide (NO) release in culture, and the degree of inhibition of T-cell proliferation was proportional to NO levels. The suppressive activity of IMCs from the bone marrow of tumor-free mice was comparable with MDSCs from BALB/c bearing mice 4T1 mammary tumors. These results indicate that IMCs have a role in regulating T-cell activation and proliferation in the BM microenvironment.
Conflict of interest statement
Figures
Similar articles
-
Anti-IL-6 receptor mAb eliminates myeloid-derived suppressor cells and inhibits tumor growth by enhancing T-cell responses.Eur J Immunol. 2012 Aug;42(8):2060-72. doi: 10.1002/eji.201142335. Eur J Immunol. 2012. PMID: 22653638
-
Antigen-specific inhibition of CD8+ T cell response by immature myeloid cells in cancer is mediated by reactive oxygen species.J Immunol. 2004 Jan 15;172(2):989-99. doi: 10.4049/jimmunol.172.2.989. J Immunol. 2004. PMID: 14707072
-
Myeloid-derived suppressor cell functionality and interaction with Leishmania major parasites differ in C57BL/6 and BALB/c mice.Eur J Immunol. 2014 Nov;44(11):3295-306. doi: 10.1002/eji.201344335. Epub 2014 Sep 19. Eur J Immunol. 2014. PMID: 25142017
-
Natural suppressor cells; past, present and future.Front Biosci (Elite Ed). 2012 Jan 1;4(4):1237-45. doi: 10.2741/e454. Front Biosci (Elite Ed). 2012. PMID: 22201949 Review.
-
Reciprocal relationship between myeloid-derived suppressor cells and T cells.J Immunol. 2013 Jul 1;191(1):17-23. doi: 10.4049/jimmunol.1300654. J Immunol. 2013. PMID: 23794702 Free PMC article. Review.
Cited by
-
Suppression of proteoglycan-induced autoimmune arthritis by myeloid-derived suppressor cells generated in vitro from murine bone marrow.PLoS One. 2014 Nov 4;9(11):e111815. doi: 10.1371/journal.pone.0111815. eCollection 2014. PLoS One. 2014. PMID: 25369029 Free PMC article.
-
Silibinin inhibits accumulation of myeloid-derived suppressor cells and tumor growth of murine breast cancer.Cancer Med. 2014 Apr;3(2):215-24. doi: 10.1002/cam4.186. Epub 2014 Jan 20. Cancer Med. 2014. PMID: 24574320 Free PMC article.
-
Distinct mechanisms govern populations of myeloid-derived suppressor cells in chronic viral infection and cancer.J Clin Invest. 2021 Aug 16;131(16):e145971. doi: 10.1172/JCI145971. J Clin Invest. 2021. PMID: 34228641 Free PMC article.
-
Granulocytic myeloid-derived suppressor cells promote angiogenesis in the context of multiple myeloma.Oncotarget. 2016 Jun 21;7(25):37931-37943. doi: 10.18632/oncotarget.9270. Oncotarget. 2016. PMID: 27177328 Free PMC article.
-
Assessment of safety and immunogenicity of MHC homozygous iPSC-derived CD34+ hematopoietic progenitors in an NHP model.Blood Adv. 2022 Sep 27;6(18):5267-5278. doi: 10.1182/bloodadvances.2022006984. Blood Adv. 2022. PMID: 35404997 Free PMC article.
References
-
- Dolcetti L, Marigo I, Mantelli B, Peranzoni E, Zanovello P, et al. (2008) Myeloid-derived suppressor cell role in tumor-related inflammation. Cancer Lett 267: 216–225. - PubMed
-
- Bronte V, Mocellin S (2009) Suppressive influences in the immune response to cancer. J Immunother 32: 1–11. - PubMed
-
- Huang B, Pan PY, Li Q, Sato AI, Levy DE, et al. (2006) Gr-1+CD115+ immature myeloid suppressor cells mediate the development of tumor-induced T regulatory cells and T-cell anergy in tumor-bearing host. Cancer Res 66: 1123–1131. - PubMed
-
- Sunderkotter C, Nikolic T, Dillon MJ, Van Rooijen N, Stehling M, et al. (2004) Subpopulations of mouse blood monocytes differ in maturation stage and inflammatory response. J Immunol 172: 4410–4417. - PubMed
-
- Bronte V, Serafini P, De Santo C, Marigo I, Tosello V, et al. (2003) IL-4-induced arginase 1 suppresses alloreactive T-cells in tumor-bearing mice. J Immunol 170: 270–278. - PubMed
Publication types
MeSH terms
Substances
LinkOut - more resources
Full Text Sources
Other Literature Sources
Research Materials
