Mapacalcine protects mouse neurons against hypoxia by blocking cell calcium overload
- PMID: 23843951
- PMCID: PMC3699608
- DOI: 10.1371/journal.pone.0066194
Mapacalcine protects mouse neurons against hypoxia by blocking cell calcium overload
Erratum in
- PLoS One. 2013;8(9). doi:10.1371/annotation/d84d3131-a400-4ca6-9c5c-9ab0be4a6dd5. Gallois, Djamila Sedjelmaci Bernard [corrected to Sedjelmaci, Djamila]; Gallois, Djamila Sedjelmaci Bernard [corrected to Gallois, Bernard]
Abstract
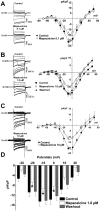
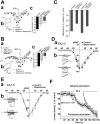
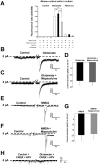
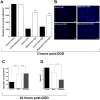
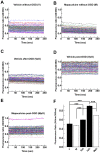
Stroke is one of a major cause of death and adult disability. Despite intense researches, treatment for stroke remains reduced to fibrinolysis, a technique useful for less than 10% of patients. Finding molecules able to treat or at least to decrease the deleterious consequences of stroke is an urgent need. Here, we showed that mapacalcine, a homodimeric peptide purified from the marine sponge Cliona vastifica, is able to protect mouse cortical neurons against hypoxia. We have also identified a subtype of L-type calcium channel as a target for mapacalcine and we showed that the channel has to be open for mapacalcine binding. The two main L-type subunits at the brain level are CaV1.3 and CaV1.2 subunits but mapacalcine was unable to block these calcium channels.Mapacalcine did not interfere with N-, P/Q- and R-type calcium channels. The protective effect was studied by measuring internal calcium level variation triggered by Oxygen Glucose Deprivation protocol, which mimics stroke, or glutamate stimulation. We showed that NMDA/AMPA receptors are not involved in the mapacalcine protection. The protective effect was confirmed by measuring the cell survival rate after Oxygen Glucose Deprivation condition. Our data indicate that mapacalcine is a promising molecule for stroke treatment.
Conflict of interest statement
Figures


Similar articles
-
Purification of a new dimeric protein from Cliona vastifica sponge, which specifically blocks a non-L-type calcium channel in mouse duodenal myocytes.Mol Pharmacol. 1997 Jun;51(6):1042-52. doi: 10.1124/mol.51.6.1042. Mol Pharmacol. 1997. PMID: 9187271
-
Glutamate preconditioning prevents neuronal death induced by combined oxygen-glucose deprivation in cultured cortical neurons.Eur J Pharmacol. 2008 Jul 28;589(1-3):85-93. doi: 10.1016/j.ejphar.2008.05.047. Epub 2008 Jun 6. Eur J Pharmacol. 2008. PMID: 18589412
-
Distribution of mapacalcine receptors in the central nervous system of rat using the [125I]-labeled mapacalcine derivative.Brain Res. 2000 Mar 6;858(1):136-42. doi: 10.1016/s0006-8993(99)02449-x. Brain Res. 2000. PMID: 10700606
-
Corticostriatal paired-pulse potentiation produced by voltage-dependent activation of NMDA receptors and L-type Ca(2+) channels.J Neurophysiol. 2002 Jan;87(1):157-65. doi: 10.1152/jn.00115.2001. J Neurophysiol. 2002. PMID: 11784738
-
125I-Labelled mapacalcine: a specific tool for a pharmacological approach to a receptor associated with a new calcium channel on mouse intestinal membranes.Biochem J. 1998 Apr 1;331 ( Pt 1)(Pt 1):177-84. doi: 10.1042/bj3310177. Biochem J. 1998. PMID: 9512477 Free PMC article.
Cited by
-
Decreased plasma miR-335 expression in patients with acute ischemic stroke and its association with calmodulin expression.J Int Med Res. 2016 Dec;44(6):1331-1338. doi: 10.1177/0300060516665707. Epub 2016 Nov 18. J Int Med Res. 2016. PMID: 27856935 Free PMC article.
-
Association of CALM1 rs3179089 Polymorphism with Ischemic Stroke in Chinese Han Population.Neuromolecular Med. 2018 Jun;20(2):271-279. doi: 10.1007/s12017-018-8492-z. Epub 2018 Apr 30. Neuromolecular Med. 2018. PMID: 29713907
-
Production, in Pichia pastoris, of a recombinant monomeric mapacalcine, a protein with anti-ischemic properties.Biochem Biophys Rep. 2015 Oct 9;4:299-305. doi: 10.1016/j.bbrep.2015.10.003. eCollection 2015 Dec. Biochem Biophys Rep. 2015. PMID: 29124217 Free PMC article.
-
Trifluoperazine regulates blood-brain barrier permeability via the MLCK/p-MLC pathway to promote ischemic stroke recovery.iScience. 2024 Feb 13;27(3):109156. doi: 10.1016/j.isci.2024.109156. eCollection 2024 Mar 15. iScience. 2024. PMID: 38439960 Free PMC article.
References
-
- Dingledine R, Borges K, Bowie D, Traynelis SF (1999) The glutamate receptor ion channels. Pharmacol Rev 51: 7–61. - PubMed
-
- McLennan H (1983) Receptors for the excitatory amino acids in the mammalian central nervous system. Prog Neurobiol 20: 251–271. - PubMed
-
- Choi DW (1988) Glutamate neurotoxicity and diseases of the nervous system. Neuron 1: 623–634. - PubMed
-
- Meldrum BS (1995) Excitatory amino acid receptors and their role in epilepsy and cerebral ischemia. Ann N Y Acad Sci 757: 492–505. - PubMed
Publication types
MeSH terms
Substances
LinkOut - more resources
Full Text Sources
Other Literature Sources

