

Integration of biochemical and electrical signaling-multiscale model of the medium spiny neuron of the striatum
- PMID: 23843966
- PMCID: PMC3700997
- DOI: 10.1371/journal.pone.0066811
Integration of biochemical and electrical signaling-multiscale model of the medium spiny neuron of the striatum
Abstract
Neuron behavior results from the interplay between networks of biochemical processes and electrical signaling. Synaptic plasticity is one of the neuronal properties emerging from such an interaction. One of the current approaches to study plasticity is to model either its electrical aspects or its biochemical components. Among the chief reasons are the different time scales involved, electrical events happening in milliseconds while biochemical cascades respond in minutes or hours. In order to create multiscale models taking in consideration both aspects simultaneously, one needs to synchronize the two models, and exchange relevant variable values. We present a new event-driven algorithm to synchronize different neuronal models, which decreases computational time and avoids superfluous synchronizations. The algorithm is implemented in the TimeScales framework. We demonstrate its use by simulating a new multiscale model of the Medium Spiny Neuron of the Neostriatum. The model comprises over a thousand dendritic spines, where the electrical model interacts with the respective instances of a biochemical model. Our results show that a multiscale model is able to exhibit changes of synaptic plasticity as a result of the interaction between electrical and biochemical signaling. Our synchronization strategy is general enough to be used in simulations of other models with similar synchronization issues, such as networks of neurons. Moreover, the integration between the electrical and the biochemical models opens up the possibility to investigate multiscale process, like synaptic plasticity, in a more global manner, while taking into account a more realistic description of the underlying mechanisms.
Conflict of interest statement
Figures

 parameter.
  is the slow timescales simulator,
  is the fast timescales simulator.

 ) and NEURON as electrical simulator (
 ).
).
 . The slight improvement of the while loop with
  and
and  for the highest number of events is due to a different load on the cluster at the time the simulations were ran. B, scalability of the event algorithm with the increase of sparseness, compared to the while loop approach which cannot cope with it.
 m.
m.


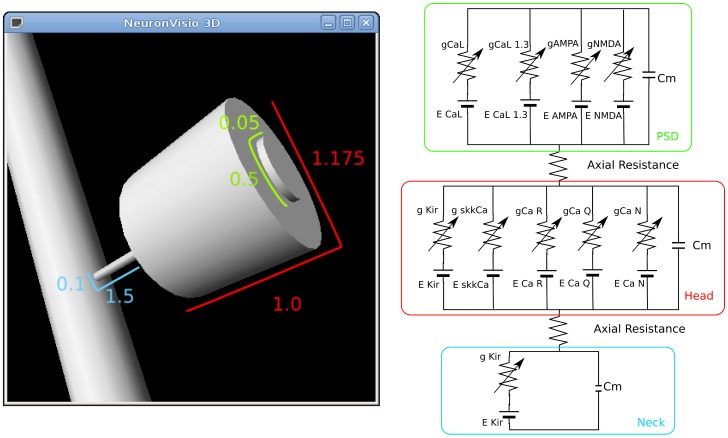
 , the post-synaptic density is in green, the head in red and the neck in blue.


Similar articles
-
Response learning stimulates dendritic spine growth on dorsal striatal medium spiny neurons.Neurobiol Learn Mem. 2018 Nov;155:50-59. doi: 10.1016/j.nlm.2018.06.008. Epub 2018 Jun 23. Neurobiol Learn Mem. 2018. PMID: 29908973
-
Electrical advantages of dendritic spines.PLoS One. 2012;7(4):e36007. doi: 10.1371/journal.pone.0036007. Epub 2012 Apr 20. PLoS One. 2012. PMID: 22532875 Free PMC article.
-
Signaling pathways involved in striatal synaptic plasticity are sensitive to temporal pattern and exhibit spatial specificity.PLoS Comput Biol. 2013;9(3):e1002953. doi: 10.1371/journal.pcbi.1002953. Epub 2013 Mar 14. PLoS Comput Biol. 2013. PMID: 23516346 Free PMC article.
-
Modeling influences of dopamine on synchronization behavior of striatum.Network. 2017;28(1):28-52. doi: 10.1080/0954898X.2017.1378824. Epub 2017 Oct 6. Network. 2017. PMID: 28985088 Review.
-
Postsynaptic integration of glutamatergic and dopaminergic signals in the striatum.Prog Neurobiol. 1994 Oct;44(2):163-96. doi: 10.1016/0301-0082(94)90037-x. Prog Neurobiol. 1994. PMID: 7831476 Review.
Cited by
-
Comparison of rule- and ordinary differential equation-based dynamic model of DARPP-32 signalling network.PeerJ. 2022 Dec 15;10:e14516. doi: 10.7717/peerj.14516. eCollection 2022. PeerJ. 2022. PMID: 36540795 Free PMC article.
-
Effects of location and extent of spine clustering on synaptic integration in striatal medium spiny neurons-a computational study.Med Biol Eng Comput. 2018 Jul;56(7):1173-1187. doi: 10.1007/s11517-017-1760-5. Epub 2017 Dec 6. Med Biol Eng Comput. 2018. PMID: 29209962
-
SBML Level 3: an extensible format for the exchange and reuse of biological models.Mol Syst Biol. 2020 Aug;16(8):e9110. doi: 10.15252/msb.20199110. Mol Syst Biol. 2020. PMID: 32845085 Free PMC article. Review.
-
Parametric Anatomical Modeling: a method for modeling the anatomical layout of neurons and their projections.Front Neuroanat. 2014 Sep 15;8:91. doi: 10.3389/fnana.2014.00091. eCollection 2014. Front Neuroanat. 2014. PMID: 25309338 Free PMC article.
-
Reproducibility in Computational Neuroscience Models and Simulations.IEEE Trans Biomed Eng. 2016 Oct;63(10):2021-35. doi: 10.1109/TBME.2016.2539602. Epub 2016 Mar 8. IEEE Trans Biomed Eng. 2016. PMID: 27046845 Free PMC article.
References
-
- Weinan E, Engquist B (2003) Multiscale modeling and computation. Notices of American Mathematical Society 50: 1062.
-
- Markram H (2006) The blue brain project. Nat Rev Neurosci 7: 153–60. - PubMed
-
- Brunel N, van Rossum M (2007) Lapicque’s 1907 paper: from frogs to integrate-and-fire. Biol Cybern 97: 337–9. - PubMed
MeSH terms
Substances
LinkOut - more resources
Full Text Sources
Other Literature Sources
Molecular Biology Databases
