. 2013 Jul 3;8(7):e66843.
doi: 10.1371/journal.pone.0066843. Print 2013.

Unravelling the complexity of human olfactory receptor repertoire by copy number analysis across population using high resolution arrays

Affiliations

Unravelling the complexity of human olfactory receptor repertoire by copy number analysis across population using high resolution arrays

Avinash M Veerappa et al. PLoS One. .

Abstract

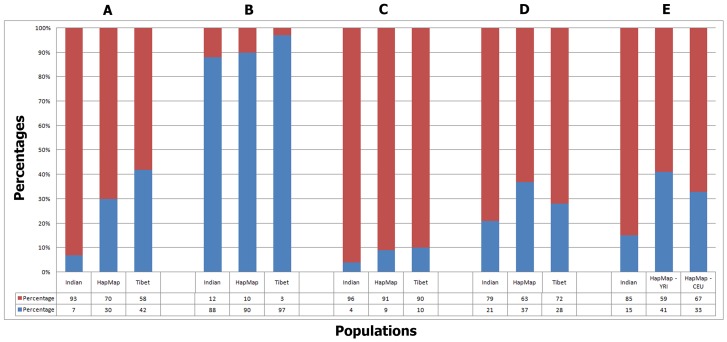
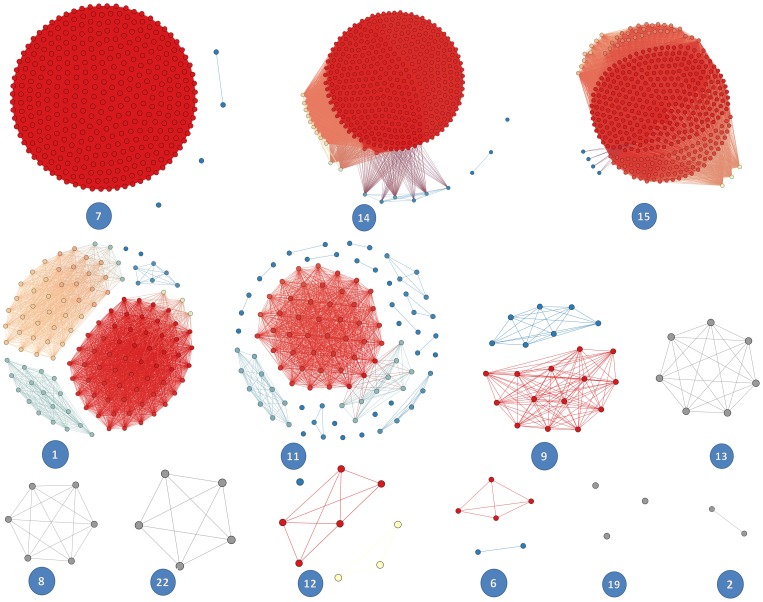
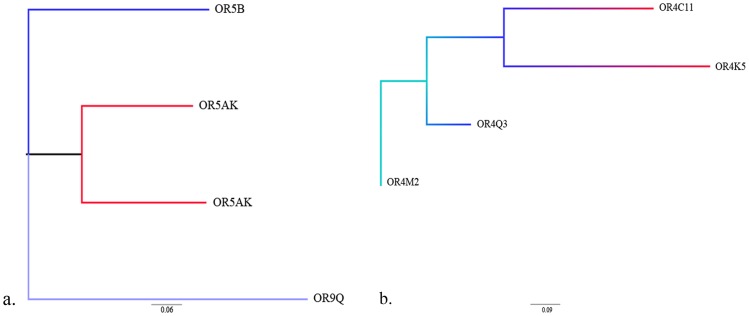
Olfactory receptors (OR), responsible for detection of odor molecules, belong to the largest family of genes and are highly polymorphic in nature having distinct polymorphisms associated with specific regions around the globe. Since there are no reports on the presence of copy number variations in OR repertoire of Indian population, the present investigation in 43 Indians along with 270 HapMap and 31 Tibetan samples was undertaken to study genome variability and evolution. Analysis was performed using Affymetrix Genome-Wide Human SNP Array 6.0 chip, Affymterix CytoScan(®) High-Density array, HD-CNV, and MAFFT program. We observed a total of 1527 OR genes in 503 CNV events from 81.3% of the study group, which includes 67.6% duplications and 32.4% deletions encompassing more of genes than pseudogenes. We report human genotypic variation in functional OR repertoire size across populations and it was found that the combinatorial effect of both "orthologous obtained from closely related species" and "paralogous derived sequences" provide the complexity to the continuously occurring OR CNVs.


Conflict of interest statement

Competing Interests: The authors have declared that no competing interests exist.

Figures

Figure 1
Figure 1. The first, second and third bars in groups A–D represent Indian, HapMap and Tibetan populations.
Group A denotes percent of subjects with OR genes with CNVs (Red) over subjects without OR genes with CNVs (Blue). 93% of Indian, 70% of HapMap and 58% of Tibetan populations were found to contain CNVs. Group B denotes the percent of OR genes with CNPs identified in this study (Red) over percent of OR genes not identified in this study (Blue). 12%, 10% and 3% of the total OR genes were found to contain CNPs in Indian, HapMap and Tibetan populations respectively. Group C represents the percent of OR intact genes (Red) over pseudogenes (Blue) with CNPs identified in this study. Indian population showed 4% and 96%, HapMap showed 9% and 91% and Tibet showed 10% and 90% of CNPs in intact and pseudogenes respectively. Group D represents deletions (Red) over duplications (Blue) identified in this study. Indian, HapMap and Tibetan populations showed 21%, 37% and 28% of deletions and 79%, 63% and 72% of duplications respectively. Group E denotes the inherited duplications (Blue 14%) and inherited deletions (Red 1%) whereas stan ds for de novo duplications (58%) and de novo deletions (27%) observed in Indian population whereas, HapMap – YRI trio data denotes 41% and 59% inherited and de novo events the and HapMap – CEU trios shows 33% and 67% inherited and de novo events.
Figure 2
Figure 2. Karyogram indicating the CNPs in different clusters of Indian, Tibetan and Hapmap OR subgenome.
Each population is represented by a particular colour. A total of 27 clusters were found from all populations, of which 10 showed overlapping. OR genes are distributed across all chromosomes except 3, 18, 21 and Y. In our study, CNPs were found on all chromosomes containing OR genes except 4, 20, and X.
Figure 3
Figure 3. Venn diagrams representing the number of overlapping common Copy Number Polymorphisms (CNPs) found in the six populations studied.
(a) represents the CNPs shared between the HapMap populations (CEU, CHB, JPT, YRI) and the Indian (IND) population (b) represents CNPs shared between the HapMap populations and the Tibetan (TBT) population. A single CNP of size 271 kb with the breakpoints 22,317,500–22,588,019 located on chromosome 15 was found in all six populations. Another CNP on the same chromosome with a size of 286 kb, with the breakpoints 22,301,994 bp –22,588,019 bp was shared by five populations and was not found in the Indian population. When both Venn diagrams are taken into consideration, Indian population showed the largest number of exclusive CNP events (35) followed by YRI (29), CEU (23), TBT (20), JPT (11) and CHB (8). The HapMap population showed a maximum of four shared CNPs, Asian populations CHB, JPT, and Tibet share one common CNP while Indian and Tibetan samples share twelve CNPs. European (CEU) and African (YRI) populations share six exclusive CNP events, whereas among the Asian populations, no CNPs were shared between CHB and JPT, as well as CHB and TBT.
Figure 4
Figure 4. A Heat Map of Log R ratios indicating the quantitative assessments of genotyping examined in a panel of 344 individuals (represented 8) used to determine copy number for the OR region with inferred functional copy number for some of the members under study can be seen here.
Each row represents human individuals and each column of the grid summarizes genotype data for the 15q11.2 OR gene cluster comprising of genes OR4M2, OR4N4 and OR4N3P. The slanting lines above the heat emission signal indicate the copy number markers, which have picked the variation. Three Tibetan (GSH540612, GSM540625, GSM540628) samples showing 15q11.2 OR gene cluster deletion and five HapMap (NA07357, NA12717, NA12891, NA18526, NA18537) samples showing both deletions and duplications in the same region.
Figure 5
Figure 5. Hot spot detection on OR CNPs was identified using HD-CNV software which generated output files containing overlapping CNV regions, seen as clusters.
Red indicates CNV hotspots; Blue indicates rare CNV spots and other colors indicate intermediate CNV events. A total of 1284 hotspots, 77 rare and 137 intermediate OR gene copy number events are distributed across 13 chromosomes.
Figure 6
Figure 6. Divergence of CNV across genome.
The tree shows the divergence of CNVs present on 11q12 chromosomal location. (b) shows the tree constructed based on the OR4 gene family, which is distributed on different chromosomal locations. Both the trees were constructed by UPGMA method.
Figure 7
Figure 7. Phylogenetic tree of the flanking recombining upstream and downstream sequence breakpoints of CNV regions – pattern of dispersal of breakpoint across taxa and within the genome of an organism.
a–d show the trees for the −1 kb upstream and downstream flanking sequences of the most common CNV event found in all the populations under the study. Figure 7e shows the tree for the −1 kb upstream flanking sequences of rare CNV event found in a population under study. These flanking sequences contain the recombining regions, whose relationship with other orthologous and paralogous sequences can be seen to determine the origin of these sequences and probable other recombining regions. The −1 kb upstream and downstream flanking sequences of the most common CNV events (22,316,500 bp –22,317,500 bp in 15q11.2), (22,474,268 bp –22,475,268 bp in 15q11.2), (22,681,064 bp –22,682,064 bp in 15q11.2), (20,104,479 bp –20,105,479 bp in 14q11.2), (19,801,529–19,802,529 in 14q11.2) found in all the populations under the study were chosen to construct the trees. Figure 7e shows the tree for the −1 kb upstream flanking sequences of rare CNV event found in a population under study. These flanking sequences contain the recombining regions, whose relationship with other orthologous and paralogous sequences can be seen to determine the origin of these sequences and probable other recombining regions.
Figure 8
Figure 8. Network of genes involved in olfactory perception with hub genes distributed in three clusters.
The network shows 135 genes (blue nodes), their co-expression (grey lines) and shared protein domains (green lines) that were identified in our study. About 50 genes are co-expressed at the transcript level; however they are inhibited by negative feedback supporting the one neuron–one receptor hypothesis. All OR genes show shared protein domains. The network generated has a clustering coefficient of 0.9, network density is 0.431 and network heterogeneity is 0.266. Each gene has an average of 57.8 neighbors.

Similar articles

Cited by

References

    1. Hasin-Brumshtein Y, Lancet D, Olender T (2009) Human olfaction: from genomic variation to phenotypic diversity. Trends Genet 25(4): 178–184. - PubMed
    1. Fuchs T, Glusman G, Horn-Saban S, Lancet D, Pilpel Y (2001) The human olfactory subgenome: from sequence to structure and evolution. Hum Genet 108(1): 1–13. - PubMed
    1. Malnic B, Godfrey PA, Buck LB (2004) The human olfactory receptor gene family. Proc Natl Acad Sci U S A 101(8): 2584–2589. - PMC - PubMed
    1. Kambere MB, Lane RP (2007) Co-regulation of a large and rapidly evolving repertoire of odorant receptor genes. BMC Neurosci 8 Suppl 3S2. - PMC - PubMed
    1. Freeman JL, Perry GH, Feuk L, Redon R, McCarroll SA, et al. (2006) Copy number variation: New insights in genome diversity. Genome Res 16: 949–961. - PubMed

Publication types

MeSH terms

Substances

LinkOut - more resources