

ANOVA-like differential expression (ALDEx) analysis for mixed population RNA-Seq
- PMID: 23843979
- PMCID: PMC3699591
- DOI: 10.1371/journal.pone.0067019
ANOVA-like differential expression (ALDEx) analysis for mixed population RNA-Seq
Abstract
Experimental variance is a major challenge when dealing with high-throughput sequencing data. This variance has several sources: sampling replication, technical replication, variability within biological conditions, and variability between biological conditions. The high per-sample cost of RNA-Seq often precludes the large number of experiments needed to partition observed variance into these categories as per standard ANOVA models. We show that the partitioning of within-condition to between-condition variation cannot reasonably be ignored, whether in single-organism RNA-Seq or in Meta-RNA-Seq experiments, and further find that commonly-used RNA-Seq analysis tools, as described in the literature, do not enforce the constraint that the sum of relative expression levels must be one, and thus report expression levels that are systematically distorted. These two factors lead to misleading inferences if not properly accommodated. As it is usually only the biological between-condition and within-condition differences that are of interest, we developed ALDEx, an ANOVA-like differential expression procedure, to identify genes with greater between- to within-condition differences. We show that the presence of differential expression and the magnitude of these comparative differences can be reasonably estimated with even very small sample sizes.
Conflict of interest statement
Figures
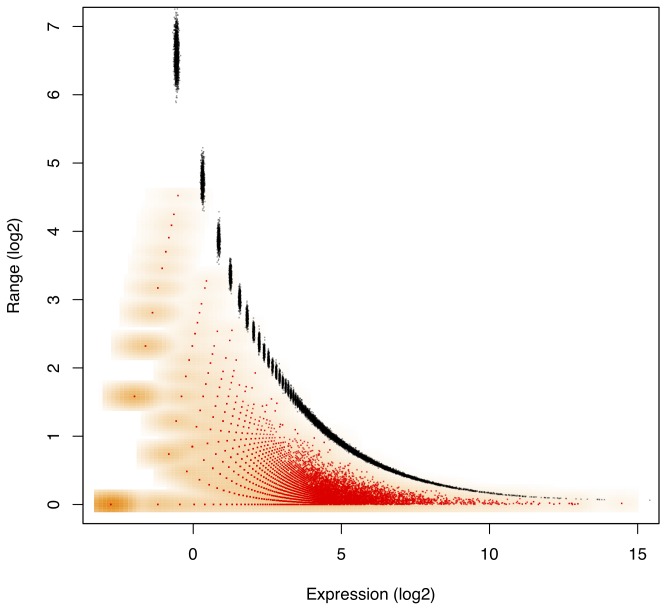
 with observed range of
  computed for the Liver library replicates in the L–K dataset. Marioni et al minimized technical error with an experimental design where the same Illumina library was run in two separate lanes. Monte Carlo Estimates of
  are shown in red with the density of the values shown in orange, while 1–99% expected quantile ranges from the Dirichlet are shown in black. This demonstrates that the error inherent in high-throughput sequencing is greatest when the counts are small and least when the counts are large. The near-perfect overlay of actual and modelled values strongly support idea that modelling proportions through a Dirichlet-multinomial process accurately accounts for the sampling variance inherent in RNA-Seq, and by extension in other high-throughput sequencing analyses. The error in estimating the expected quantiles is observable by the size of the points plotted in black and becomes small when expression is non-trivial. Values on the
  -axis were calculated with the given formula for
  and were adjusted to remove the non-informative subspace as outlined in the text. Thus the
  -axis value of zero corresponds to the expected per-gene log
 -expression value.
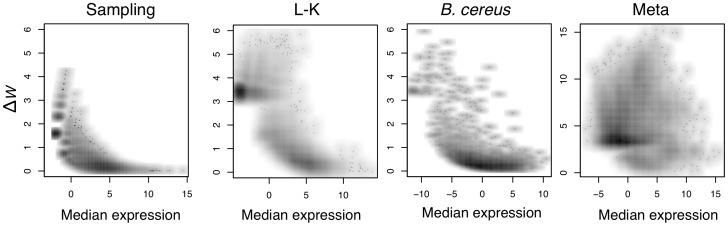
 , and that estimate only becomes imprecise as
  becomes very small. The Meta-RNA-Seq panel shows that when within-condition variance is high, there is no relationship between the expression level and the within-condition variance. Note that base-2 logarithms were used throughout.
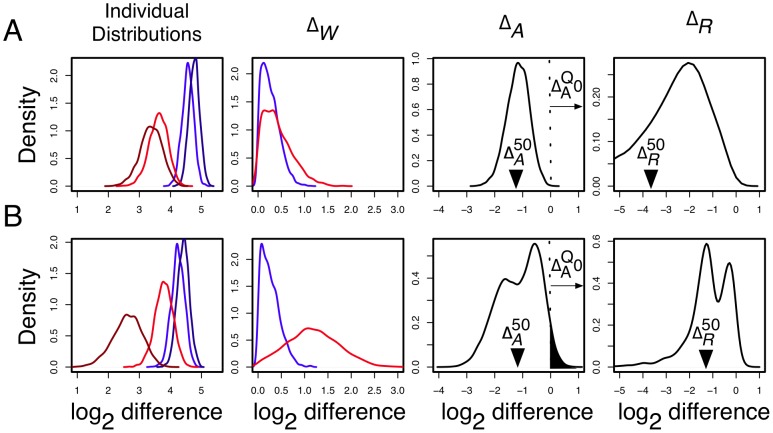
 ) of -1.17 and -1.13 but very different relative fold differences (
 ) and
) and  values in the L-K dataset. Dirichlet sampled distributions are generated from the raw read counts as described in the text. These distributions are log-transformed and the noninformative subspace is removed. Posterior distributions of
  are shown for
  and for replicates
  . Both genes are abundantly expressed in this dataset, with median expression levels between
  and
and  greater than the mean across-gene expression level.
  is computed by randomly sampling one of the red distributions, randomly sampling one of the blue distributions, and subtracting for all pairs of between-condition distributions.
  is computed by sampling a light and a dark from each red and blue distributions, subtracting light and dark, and selecting the difference with the greatest magnitude.
  is computed as the ratio of a single realization of
  and
and  , and is computed for each realization of
  and
and  . The
. The  distribution is narrower in A than in B implying a greater precision in estimating this value. This precision can be estimated by
  , the quantile of zero in
  , which is shown graphically as the black-filled area under the
  distribution curves. The
  values are 0.0001 and 0.035 in panels A and B respectively. The vertical arrows show the median values of
  and
and  . Thus, the between-condition expression values for the gene in Panel A are scored as separable by ALDEx (
 ) but not for the gene in Panel B (
 ). These conclusions agree with inspection-based intuition from examining the initial adjusted log-expression distributions that are shown in the left panel.
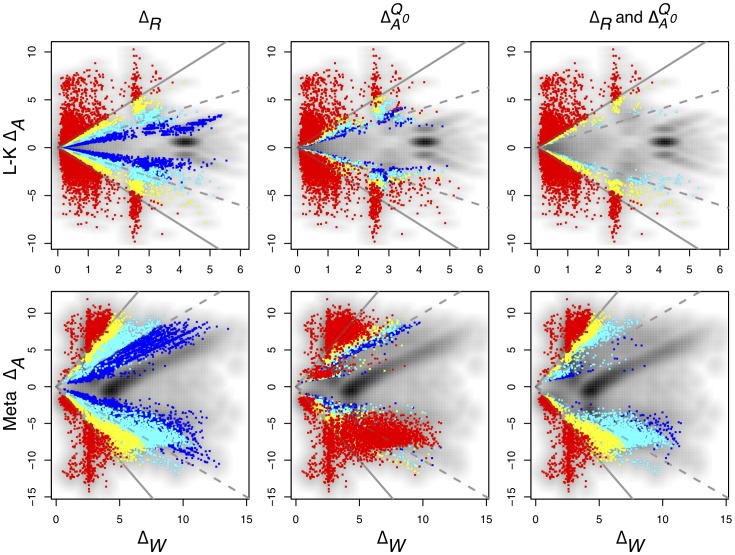
 (i.e., the
  -fold expression changes) vs.
  (i.e., the maximum within-condition expression differences) for the L-K and Meta-RNA-Seq datasets. The grey background shows the density plot of the values. By construction, threshold
  values of
  should select genes for which the between-condition variation is reasonably likely to be at least twice the within-condition variation. This threshold is illustrated by the solid grey line, and the within/between-condition equivalence line is shown as the dashed grey line. The effect of altering the
  and
and  cutoffs is shown. Large
  values identify genes with a larger between-condition differential expression than within-condition variation. The
  values were
  (blue),
  (cyan),
  (yellow) and
  (red). There are a number of points where the
  values exceed the chosen threshold in both the L-K and Meta datasets. The
  column shows the effect of identifying genes based on the estimated proportion of
  . These are plotted for values of 0.1, 0.05, 0.01 and 0.001 in the two datasets, again coloured as blue, cyan, yellow or red respectively. Here we observed that the 0.01 and 0.001 cutoffs were very similar and the larger cutoffs admitted many more genes with high within-condition variation. The third panel shows the effect of enforcing the
  along with each of the
  cutoff values. In this case we observe that a
  combined with an
  is sufficient to ensure that genes identified as differentially expressed always have lower
  than
than  values in both datasets. Using both values in combination allows arbitrarily small fold expression differences to be identified if they are supported by high within-condition concordance.
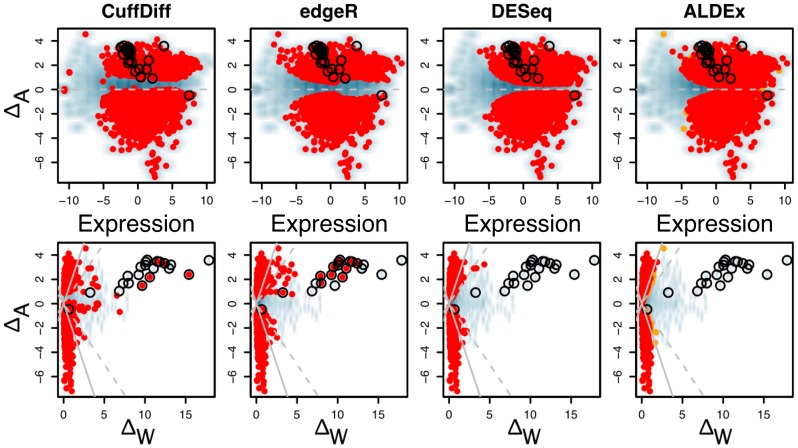
 are highlighted in red and orange for
  and
and  . Transcripts originating from genes contained on the plasmid that is found in one sample from each condition are circled. The top row shows typical Bland-Altman style (MA) plots where the median absolute fold change (
 ) is plotted vs. the mean expression value (Expression). The mean expression value on x-axis is 0 for the reasons outlined in the text. Notice that the edgeR method identifies differentially-expressed transcripts with much lower abundances than the other three methods. The plasmid-encoded genes are not differentiated on the Bland-Altman-style plots. The bottom row shows an MW plot of the median absolute fold change between-conditions (
 ) vs. the maximum within-condition difference (
 ) of the same data. Here it is clear that transcripts originating from the plasmid-encoded genes exhibit very large
  values. Interestingly, there are a number of chromosomally-encoded genes in this dataset, and in the other two (see previous figure) that also show large
  values, demonstrating that within-condition variation can be problematic even for samples derived from well-controlled conditions. Both CuffDiff and edgeR identified as differentially expressed a significant fraction of the plasmid-derived transcripts.
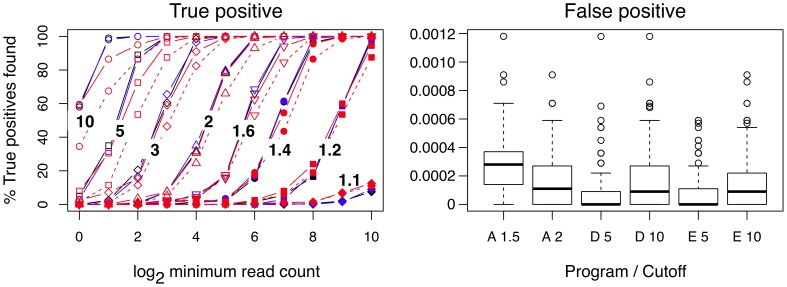
 cutoff of 1.5 is a solid and 2.0 is a dashed line. The right panel shows the per-gene false positive rate for each method at two cutoffs. False positive events in this model can only arise through outliers in the Dirichlet sampling procedure. The rate was calculated by dividing the number of false positive genes identified in each trial by the number of genes in the dataset (5358). The boxplot shows the range of false positive rates observed for each method across all trials and all expression levels. A rate of 0.0002 corresponds to approximately 1 false positive per trial in this dataset.
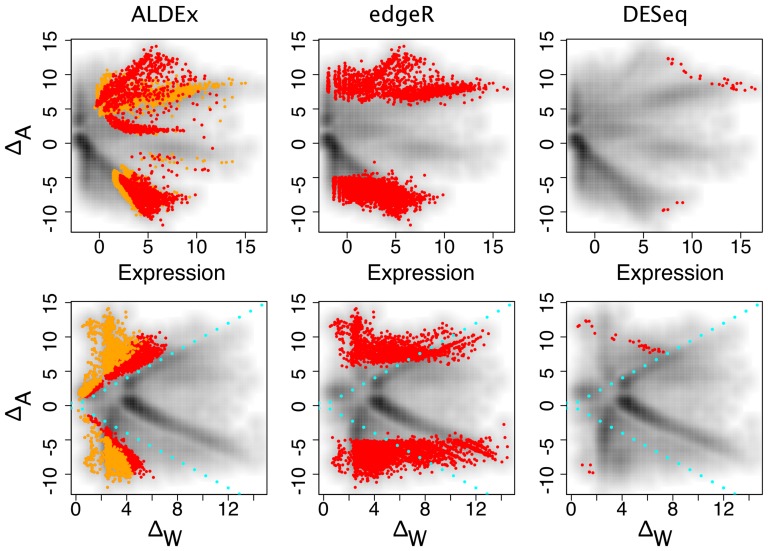
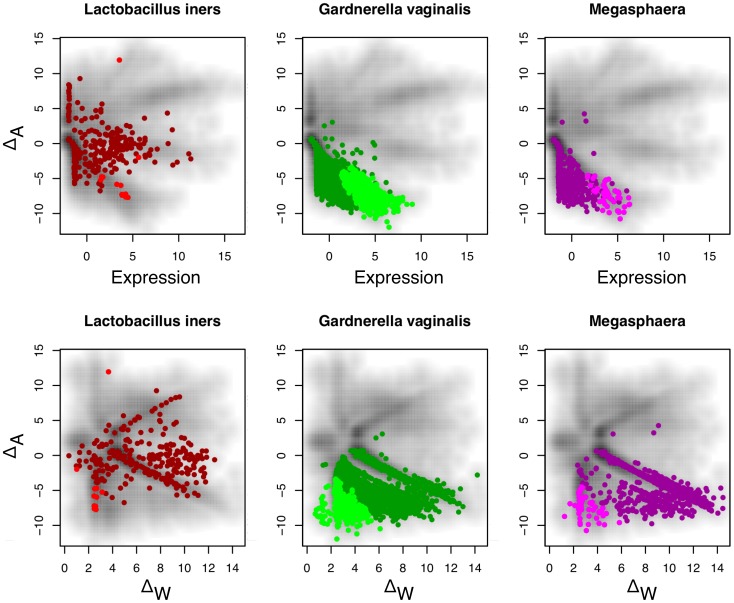
 ) in three or four samples can exhibit both up and down regulation in the two conditions. For example, transcripts that were derived from L. iners are seen to be both up- and down-regulated in this dataset. Transcripts from organisms that are abundant in both samples of one condition (e.g. G. vaginalis), exhibit a change in one direction only, and show the full range of within-condition variation. In this case, many genes from the organism are expressed concordantly, and can be identified as differential. Transcripts from organisms that are abundant in only one sample of one condition, e.g. Megasphaera species, show a similar pattern as the previous one, but there is much more extreme variation within-conditions, and only those few genes that are expressed at extremely high levels can be reliably called as differentially expressed.
References
-
- Roy NC, Altermann E, Park ZA, McNabb WC (2011) A comparison of analog and next-generation transcriptomic tools for mammalian studies. Brief Funct Genomics 10: 135–50. - PubMed
Publication types
MeSH terms
Substances
Grants and funding
LinkOut - more resources
Full Text Sources
Other Literature Sources
Research Materials
