

Negative regulation of neuromedin U mRNA expression in the rat pars tuberalis by melatonin
- PMID: 23843987
- PMCID: PMC3699551
- DOI: 10.1371/journal.pone.0067118
Negative regulation of neuromedin U mRNA expression in the rat pars tuberalis by melatonin
Abstract
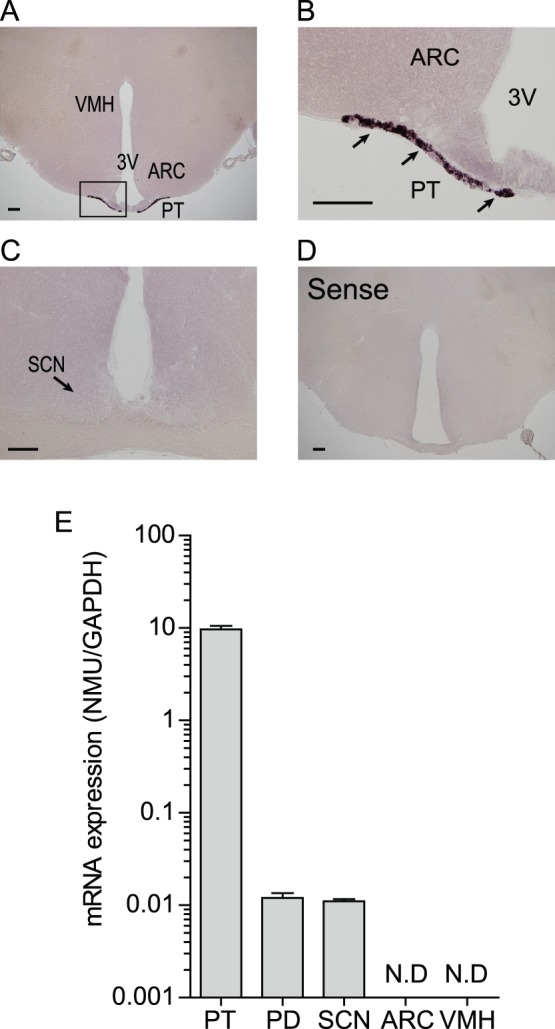
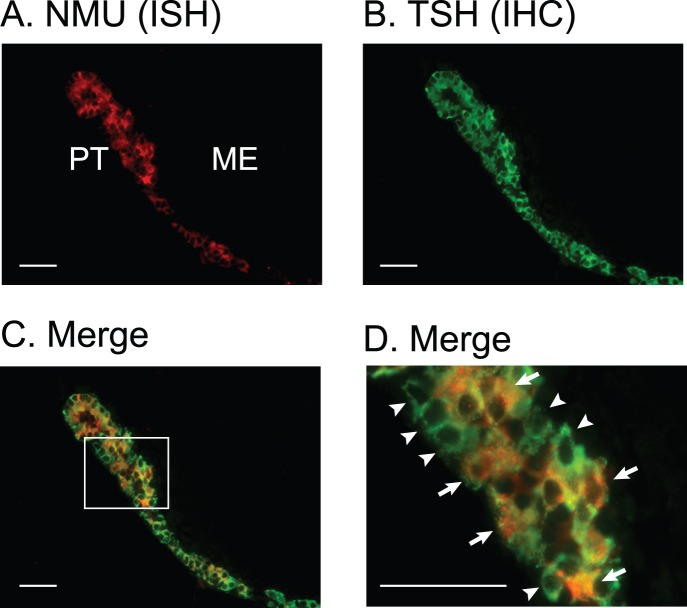
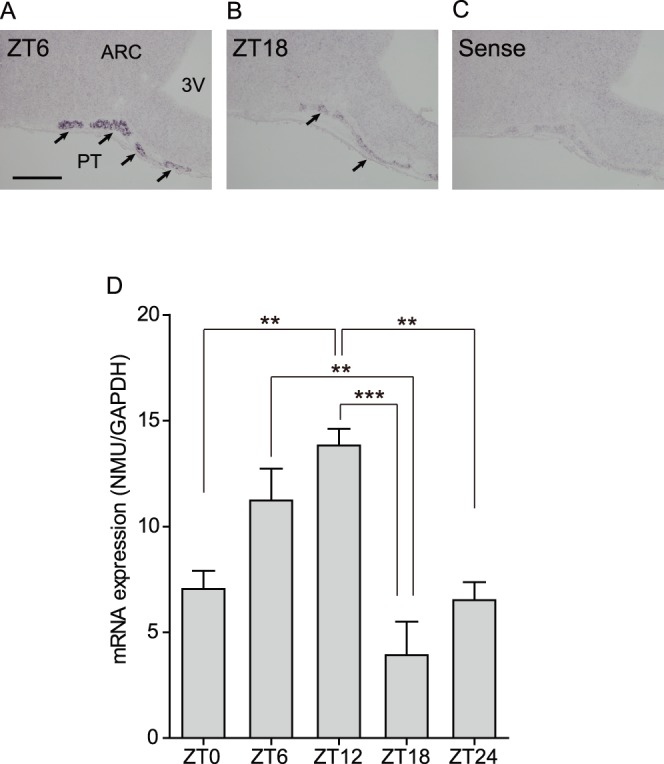
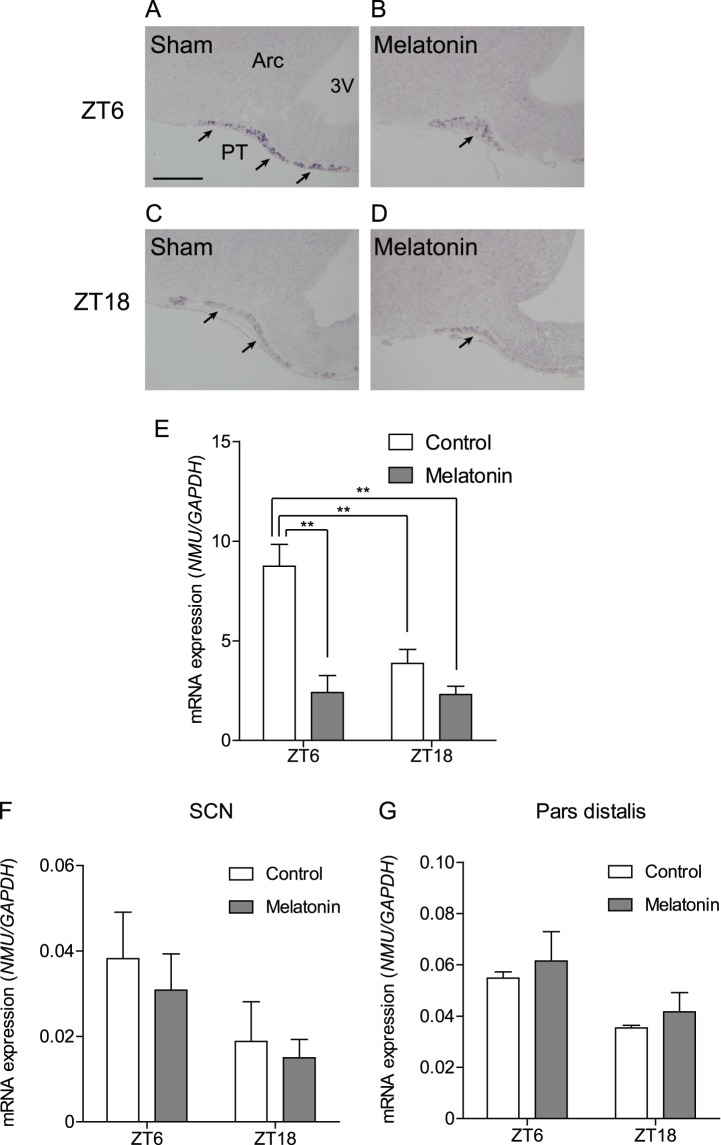
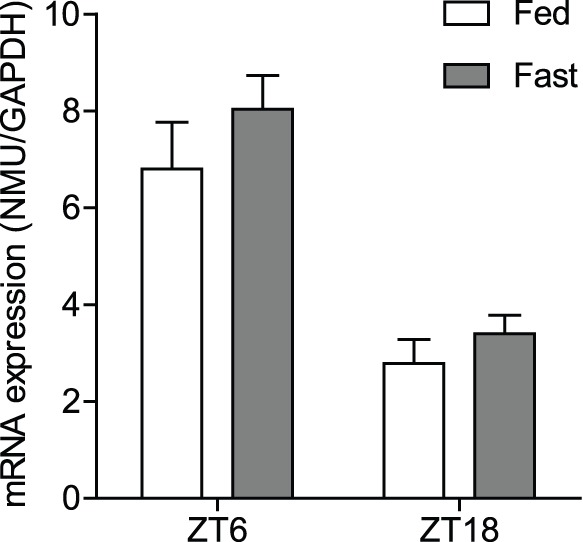
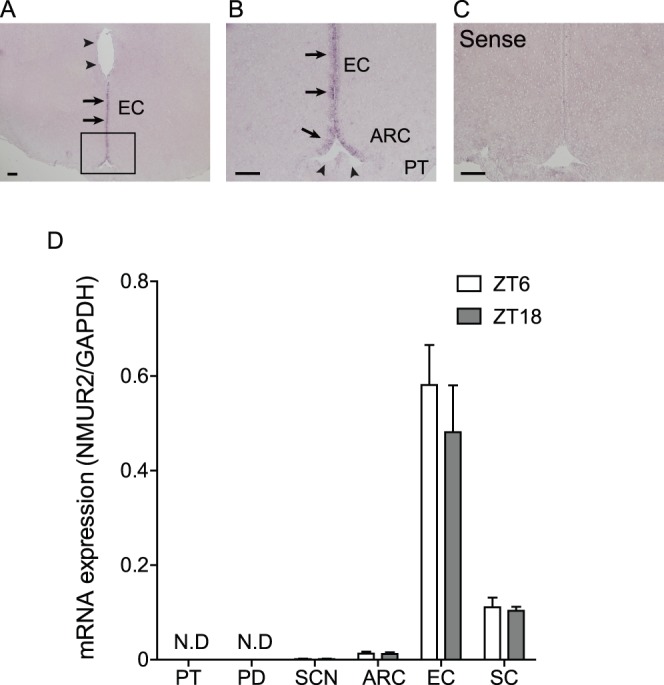
The pars tuberalis (PT) is part of the anterior pituitary gland surrounding the median eminence as a thin cell layer. The characteristics of PT differ from those of the pars distalis (PD), such as cell composition and gene expression, suggesting that the PT has a unique physiological function compared to the PD. Because the PT highly expresses melatonin receptor type 1, it is considered a mediator of seasonal and/or circadian signals of melatonin. Expression of neuromedin U (NMU) that is known to regulate energy balance has been previously reported in the rat PT; however, the regulatory mechanism of NMU mRNA expression and secretion in the PT are still obscure. In this study, we examined both the diurnal change of NMU mRNA expression in the rat PT and the effects of melatonin on NMU in vivo. In situ hybridization and quantitative PCR analysis of laser microdissected PT samples revealed that NMU mRNA expression in the PT has diurnal variation that is high during the light phase and low during the dark phase. Furthermore, melatonin administration significantly suppressed NMU mRNA expression in the PT in vivo. On the other hand, 48 h fasting did not have an effect on PT-NMU mRNA expression, and the diurnal change of NMU mRNA expression was maintained. We also found the highest expression of neuromedin U receptor type 2 (NMUR2) mRNA in the third ventricle ependymal cell layer, followed by the arcuate nucleus and the spinal cord. These results suggest that NMU mRNA expression in the PT is downregulated by melatonin during the dark phase and shows diurnal change. Considering that NMU mRNA in the PT showed the highest expression level in the brain, PT-NMU may act on NMUR2 in the brain, especially in the third ventricle ependymal cell layer, with a circadian rhythm.
Conflict of interest statement
Figures
Similar articles
-
Negative energy balance and leptin regulate neuromedin-U expression in the rat pars tuberalis.J Endocrinol. 2006 Aug;190(2):545-53. doi: 10.1677/joe.1.06577. J Endocrinol. 2006. PMID: 16899587
-
Diurnal change of thyroid-stimulating hormone mRNA expression in the rat pars tuberalis.J Neuroendocrinol. 2007 Nov;19(11):839-46. doi: 10.1111/j.1365-2826.2007.01603.x. J Neuroendocrinol. 2007. PMID: 17927662
-
Adenosine stimulates neuromedin U mRNA expression in the rat pars tuberalis.Mol Cell Endocrinol. 2019 Oct 1;496:110518. doi: 10.1016/j.mce.2019.110518. Epub 2019 Jul 22. Mol Cell Endocrinol. 2019. PMID: 31344393
-
Signaling pathways to and from the hypophysial pars tuberalis, an important center for the control of seasonal rhythms.Gen Comp Endocrinol. 2018 Mar 1;258:236-243. doi: 10.1016/j.ygcen.2017.05.011. Epub 2017 May 13. Gen Comp Endocrinol. 2018. PMID: 28511899 Review.
-
Does a melatonin-dependent circadian oscillator in the pars tuberalis drive prolactin seasonal rhythmicity?J Neuroendocrinol. 2007 Aug;19(8):657-66. doi: 10.1111/j.1365-2826.2007.01564.x. J Neuroendocrinol. 2007. PMID: 17620107 Review.
Cited by
-
Insights Into the Research Status of Neuromedin U: A Bibliometric and Visual Analysis From 1987 to 2021.Front Med (Lausanne). 2022 Feb 22;9:773000. doi: 10.3389/fmed.2022.773000. eCollection 2022. Front Med (Lausanne). 2022. PMID: 35273971 Free PMC article.
-
Tanycyte Gene Expression Dynamics in the Regulation of Energy Homeostasis.Front Endocrinol (Lausanne). 2019 May 7;10:286. doi: 10.3389/fendo.2019.00286. eCollection 2019. Front Endocrinol (Lausanne). 2019. PMID: 31133987 Free PMC article. Review.
-
Quantifying the contribution of Neanderthal introgression to the heritability of complex traits.Nat Commun. 2021 Jul 22;12(1):4481. doi: 10.1038/s41467-021-24582-y. Nat Commun. 2021. PMID: 34294692 Free PMC article.
-
Neuroanatomical characterization of the Nmu-Cre knock-in mice reveals an interconnected network of unique neuropeptidergic cells.Open Biol. 2023 Jun;13(6):220353. doi: 10.1098/rsob.220353. Epub 2023 Jun 14. Open Biol. 2023. PMID: 37311538 Free PMC article.
-
Neuromedin U Deficiency Disrupts Daily Testosterone Fluctuation and Reduces Wheel-Running Activity in Rats.Endocrinology. 2025 Jun 10;166(8):bqaf102. doi: 10.1210/endocr/bqaf102. Endocrinology. 2025. PMID: 40469000 Free PMC article.
References
-
- Rudolf T, Filler T, Wittkowski W (1993) Pars tuberalis specific cells within the pars distalis of the adenohypophysis. An ontogenetic study. Ann Anat 175: 171–176. - PubMed
-
- Sakai T, Inoue K, Kurosumi K (1992) Light and electron microscopic immunocytochemistry of TSH-like cells occurring in the pars tuberalis of the adult male rat pituitary. Arch Histol Cytol 55: 151–157. - PubMed
-
- Williams LM, Morgan PJ (1988) Demonstration of melatonin-binding sites on the pars tuberalis of the rat. J Endocrinol 119: R1–3. - PubMed
-
- Carlson LL, Weaver DR, Reppert SM (1989) Melatonin signal transduction in hamster brain: inhibition of adenylyl cyclase by a pertussis toxin-sensitive G protein. Endocrinology 125: 2670–2676. - PubMed
-
- Klosen P, Bienvenu C, Demarteau O, Dardente H, Guerrero H, et al. (2002) The mt1 melatonin receptor and RORbeta receptor are co-localized in specific TSH-immunoreactive cells in the pars tuberalis of the rat pituitary. J Histochem Cytochem 50: 1647–1657. - PubMed
MeSH terms
Substances
LinkOut - more resources
Full Text Sources
Other Literature Sources
Molecular Biology Databases
Miscellaneous
