

Hypokalemia, its contributing factors and renal outcomes in patients with chronic kidney disease
- PMID: 23843989
- PMCID: PMC3699540
- DOI: 10.1371/journal.pone.0067140
Hypokalemia, its contributing factors and renal outcomes in patients with chronic kidney disease
Abstract
Background: In the chronic kidney disease (CKD) population, the impact of serum potassium (sK) on renal outcomes has been controversial. Moreover, the reasons for the potential prognostic value of hypokalemia have not been elucidated.
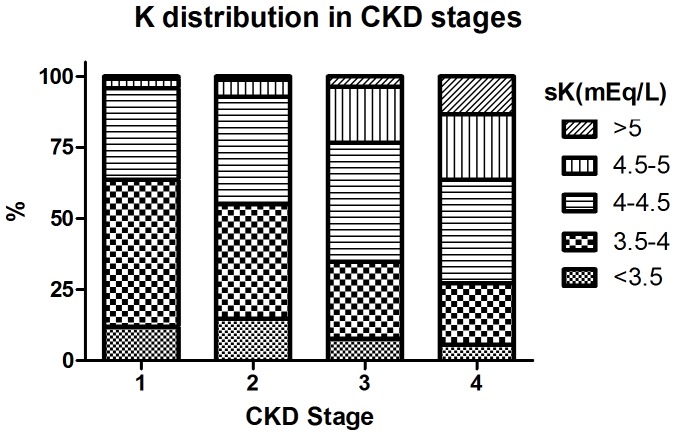
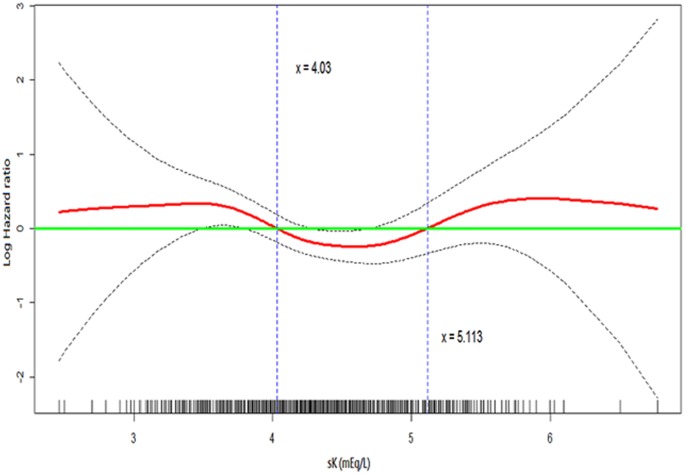
Design participants & measurements: 2500 participants with CKD stage 1-4 in the Integrated CKD care program Kaohsiung for delaying Dialysis (ICKD) prospective observational study were analyzed and followed up for 2.7 years. Generalized additive model was fitted to determine the cutpoints and the U-shape association between sK and end-stage renal disease (ESRD). sK was classified into five groups with the cutpoints of 3.5, 4, 4.5 and 5 mEq/L. Cox proportional hazard regression models predicting the outcomes were used.
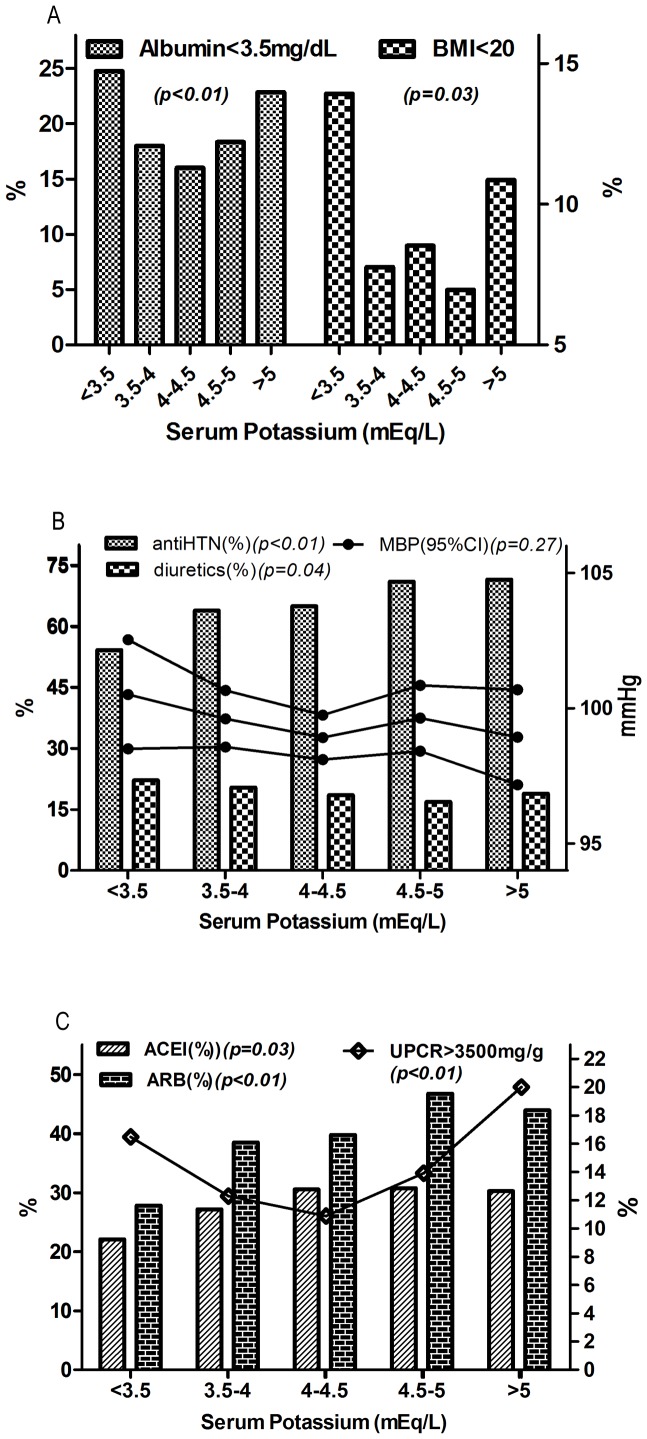
Results: The mean age was 62.4 years, mean sK level was 4.2±0.5 mEq/L and average eGFR was 40.6 ml/min per 1.73 m(2). Female vs male, diuretic use vs. non-use, hypertension, higher eGFR, bicarbonate, CRP and hemoglobin levels significantly correlated with hypokalemia. In patients with lower sK, nephrotic range proteinuria, and hypoalbuminemia were more prevalent but the use of RAS (renin-angiotensin system) inhibitors was less frequent. Hypokalemia was significantly associated with ESRD with hazard ratios (HRs) of 1.82 (95% CI, 1.03-3.22) in sK <3.5mEq/L and 1.67 (95% CI,1.19-2.35) in sK = 3.5-4 mEq/L, respectively, compared with sK = 4.5-5 mEq/L. Hyperkalemia defined as sK >5 mEq/L conferred 1.6-fold (95% CI,1.09-2.34) increased risk of ESRD compared with sK = 4.5-5 mEq/L. Hypokalemia was also associated with rapid decline of renal function defined as eGFR slope below 20% of the distribution range.
Conclusion: In conclusion, both hypokalemia and hyperkalemia are associated with increased risk of ESRD in CKD population. Hypokalemia is related to increased use of diuretics, decreased use of RAS blockade and malnutrition, all of which may impose additive deleterious effects on renal outcomes.
Conflict of interest statement
Figures
References
-
- Giebisch G, Hebert SC, Wang WH (2003) New aspects of renal potassium transport. Pflugers Arch 446: 289–297. - PubMed
MeSH terms
Substances
LinkOut - more resources
Full Text Sources
Other Literature Sources
Medical
Research Materials
Miscellaneous
