. 2013 Jul 3;8(7):e67595.
doi: 10.1371/journal.pone.0067595. Print 2013.

RP1 is a phosphorylation target of CK2 and is involved in cell adhesion

Affiliations

RP1 is a phosphorylation target of CK2 and is involved in cell adhesion

Frank Stenner et al. PLoS One. .

Abstract

RP1 (synonym: MAPRE2, EB2) is a member of the microtubule binding EB1 protein family, which interacts with APC, a key regulatory molecule in the Wnt signalling pathway. While the other EB1 proteins are well characterized the cellular function and regulation of RP1 remain speculative to date. However, recently RP1 has been implicated in pancreatic cancerogenesis. CK2 is a pleiotropic kinase involved in adhesion, proliferation and anti-apoptosis. Overexpression of protein kinase CK2 is a hallmark of many cancers and supports the malignant phenotype of tumor cells. In this study we investigate the interaction of protein kinase CK2 with RP1 and demonstrate that CK2 phosphorylates RP1 at Ser(236) in vitro. Stable RP1 expression in cell lines leads to a significant cleavage and down-regulation of N-cadherin and impaired adhesion. Cells expressing a Phospho-mimicking point mutant RP1-ASP(236) show a marked decrease of adhesion to endothelial cells under shear stress. Inversely, we found that the cells under shear stress downregulate endogenous RP1, most likely to improve cellular adhesion. Accordingly, when RP1 expression is suppressed by shRNA, cells lacking RP1 display significantly increased cell adherence to surfaces. In summary, RP1 phosphorylation at Ser(236) by CK2 seems to play a significant role in cell adhesion and might initiate new insights in the CK2 and EB1 family protein association.


Conflict of interest statement

Competing Interests: The authors have declared that no competing interests exist.

Figures

Figure 1
Figure 1. Binding and Phosphorylation of RP1 by CK2.
1A Identification of CK2 phosphorylation site - RP1-sequence (amino acid), three potential CK2 kinase sites S59, S72, S236 (underlined) were identified by prosite scan (www.expasy.ch). The peptides used for in vitro experiments (1C) are marked in bold. S236 the actual CK2 phosphorylation site is shown in red. 1B Interaction–assay RP1/CK2 - Endogenous RP1 (first panel) was co-precipitated with its potential binding partners. RP1/CK2 kinase interaction could be detected by specific α/ß CK2 subunit antibodies. The black wedges in this panel indicate increasing stringency of washing procedure (% Tween20/PBS). In a reverse experiment (right side panel), endogenous RP1 was verified as genuine CK2 binding substrate. By using CK2 subunits as baits, RP1 could be detected in the pulldowns by its specific RP1 antibody (right panel). No signal was seen when an insignificant IgG antibody was used. On the far right 1/10 of cell lysate of the foregoing experiments is depicted as an input control. The black wedges in this panel indicate stringency of the washing procedure (0.01% and 0.3% Tween/PBS). 1C Biotinylated peptides (A: aa54–65, B: aa70–80, C: aa229–240) containing the potential CK2 phosphorylation sites S59, S72, S236 were synthesized and tested as CK2 phosphorylation substrates (A, B, C, 3 µg each) in an in vitro phosphorylation assay. A known positive CK2 kinase site peptide (DDDDSDDDDD, 3 µg) served as a control. The black wedge indicates incubation times (minutes). 1D CK2 kinase assay - Recombinant CK2 and 33P-gamma-ATP were incubated in vitro with different amounts of RP1-wt protein (first panel shows a coomassie stain of his-tagged purified RP1 protein used for the assay) and phosphorylation was measured by autoradiography (middle panel). The amounts of RP1 protein used are indicated above the middle panel. Autophosphorylation of CK2 at its subunit ß served as positive control RP1-ALA236 mutated protein (ALA) was almost non-phosphorylated in comparison to the wild type protein (right side upper panel). The lower panel on the right side shows a coomassie stain representing the amount of RP1 used for this experiment.
Figure 2
Figure 2. Shear Stress experiments.
2A Analysis of shear stress-dependent adhesion of RP1 mutants on endothelial cells under flow 1×10⁵ HEK293 cells stably transfected with different RP1 mutants were allowed to settle for 3 min on parallel plate flow chambers with pre grown confluent HUVECs. Subsequently, preheated HBSS/0.1% BSA was flushed through the chambers at the indicated calculated shear stress, and shear stress levels were increased every 30 s. Photographs were taken and adherent cells were counted in four fields for every condition. Cell line with empty vector (black squares), RP1 wild type (wt) (black circles), RP1-ALA236 (ALA) mutant (white circles), RP1-ASP236 (ASP) mutant (white squares). Values are means of n = 5–6+/− SEM. Asterisks denote statistically significant differences *p<0.05 or **p<0.01 between parental cell line and ASP mutant as determined by a two-tailed t-test. 2B Analysis of RP1 expression under fluid shear stress Native HEK293 cells were exposed to fluid shear stress or simply cultured (control). Thereafter, cells were lysed and total protein from the lysates was employed in immunoprecipitation of RP1. Endogenous RP1 was detected by an RP1 specific antibody. α-tubulin served as a loading control. RP-1protein detected by Western blot was quantified using the ImageJ software. Asterisks mark statistically significant differences **p<0.01 between sheared and non-sheared cells as determined by a two-tailed t-test. 2C Analysis of RP1 phosphorylation under fluid shear stress HEK293 cells overexpressing RP1-wt were exposed to 1dynes/cm2 shear stress. From cell lysate RP1 was immunoprecipitated and subjected to Western blotting. In parallel the phosphorylation status of RP1 was detected with an anti phospho-serine antibody (anti PS). As control HEK293 cells overexpressing RP1-wt were cultured without shear stress and otherwise processed alike. Total RP1 (RP1) expression served as loading control. The difference between phosphorylation intensity in sheared versus control cells was statistically significant (**, p<0.05). 2D Analysis of RP1 shRNA regulated cells and RP1 phosphor-mutants under fluid shear stress HEK293 containing empty vector or various mutants were exposed to increasing shear stress. The curves show the percentage of adhering cells under different shear stress intensity (0, 1.5, 4.5 and 8.5 dynes/cm2) on control cells transfected with irrelevant shRNA served as a reference (black boxes) and were compared to RP1 specific shRNA bearing cells and the mutant cell lines RP1-ALA236, RP1-ASP236. A significant gain of cell adhesion is seen for RP1 specific shRNAs (white boxes). The statistical differences of adherent cells between the depicted cell lines and the control cells are marked with Asterisks *p<0.05 or **p<0.01.
Figure 3
Figure 3. G- and F-Actin in RP1-expressing cells.
3A G- and F-actin content of 10×105 constitutively RP1 expressing cells were measured by FACS analysis. G-Actin (green) was measured in the FL-1 channel (Fluor 488, green) and F-Actin in the FL-3 channel (phalloidin rodamine staining, red). The upper left quadrant of each panel represents the F-actin pool, the upper right quadrant the G-Actin pool. The top three panels are the controls: Upper left panel, unstained control cells. Upper middle panel: Boiled fluoresceine conjugated DNAse I unable to bind G-Actin serving as a negative control. Upper right panel: Double staining of HEK293 cells with Fluor 488 conjugated DNAse I and Phalloidin-Rhodamine carrying the empty pEAK8 vector to determine the general content of G-actin and F-actin pools as reference. The bottom panels show the respective degree of G-actin decrease seen in the RP1-wt, ALA, ASP containing cell lines. 3B Quantification of G-Actin content in RP1 expressing HEK293 cells compared to mock transfected cells from 3A. Differences marked by asterisks were statistically significant using the two-tailed Fisher’s exact test (**p = 0.0001;*p = 0.0003).
Figure 4
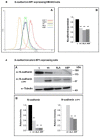
Figure 4. Cadherin expression in RP1-mutants.
4A N-cadherin levels of HEK293 cells containing empty vector (c), wt, ALA and ASP were determined by immunoblotting with an N-terminal N-cadherin antibody. The middle panel shows a processed N-cadherin fragment (named CTF1) detected by a fragment specific antibody in respective lysates. The lower panel shows the β-tubulin loading control. 4B The Western blot signals of 4A were quantified using the Image-J software (Rasband, W.S., ImageJ, U. S. National Institutes of Health, Bethesda, Maryland, USA, http://rsb.info.nih.gov/ij/, 1997–2008). Differences marked by asterisks were statistically significant using the two-tailed Fisher’s exact test (**p<0.001) comparing control versus wt and mutants regarding complete N-cadherin and comparing wt versus mutants regarding N-cadherin cleavage fragment (CTF1). In the right panel, the empty c lane indicates no detectable CTF in control cells. 4C N-cadherin levels were measured by incubation with a monoclonal antibody directed against the cytoplasmic tail and subsequent FACS analysis. The negative control (yellow line) was incubated with secondary antibody only. The positive control (red) was empty vector containing HEK293 cells. The results for HEK293 expressing RP1-wt are depicted in black, RP1-ALA236 in green and RP1-ASP236 in blue. 4D Quantification of N-cadherin levels from FACS analysis. Differences marked by asterisks were statistically significant using the two-tailed Fisher’s exact test (**p<0.001).

References

    1. Bu W, Su LK (2003) Characterization of functional domains of human EB1 family proteins. J Biol Chem 278: 49721–49731. - PubMed
    1. Su LK, Qi Y (2001) Characterization of human MAPRE genes and their proteins. Genomics 71: 142–149. - PubMed
    1. Su LK, Burrell M, Hill DE, Gyuris J, Brent R, et al. (1995) APC binds to the novel protein EB1. Cancer Res 55: 2972–2977. - PubMed
    1. Renner C, Pfitzenmeier JP, Gerlach K, Held G, Ohnesorge S, et al. (1997) RP1, a new member of the adenomatous polyposis coli-binding EB1-like gene family, is differentially expressed in activated T cells. J Immunol 159: 1276–1283. - PubMed
    1. Bu W, Su LK (2001) Regulation of microtubule assembly by human EB1 family proteins. Oncogene 20: 3185–3192. - PubMed