

An integrative framework for Bayesian variable selection with informative priors for identifying genes and pathways
- PMID: 23844055
- PMCID: PMC3700986
- DOI: 10.1371/journal.pone.0067672
An integrative framework for Bayesian variable selection with informative priors for identifying genes and pathways
Abstract
The discovery of genetic or genomic markers plays a central role in the development of personalized medicine. A notable challenge exists when dealing with the high dimensionality of the data sets, as thousands of genes or millions of genetic variants are collected on a relatively small number of subjects. Traditional gene-wise selection methods using univariate analyses face difficulty to incorporate correlational, structural, or functional structures amongst the molecular measures. For microarray gene expression data, we first summarize solutions in dealing with 'large p, small n' problems, and then propose an integrative Bayesian variable selection (iBVS) framework for simultaneously identifying causal or marker genes and regulatory pathways. A novel partial least squares (PLS) g-prior for iBVS is developed to allow the incorporation of prior knowledge on gene-gene interactions or functional relationships. From the point view of systems biology, iBVS enables user to directly target the joint effects of multiple genes and pathways in a hierarchical modeling diagram to predict disease status or phenotype. The estimated posterior selection probabilities offer probabilitic and biological interpretations. Both simulated data and a set of microarray data in predicting stroke status are used in validating the performance of iBVS in a Probit model with binary outcomes. iBVS offers a general framework for effective discovery of various molecular biomarkers by combining data-based statistics and knowledge-based priors. Guidelines on making posterior inferences, determining Bayesian significance levels, and improving computational efficiencies are also discussed.
Conflict of interest statement
Figures
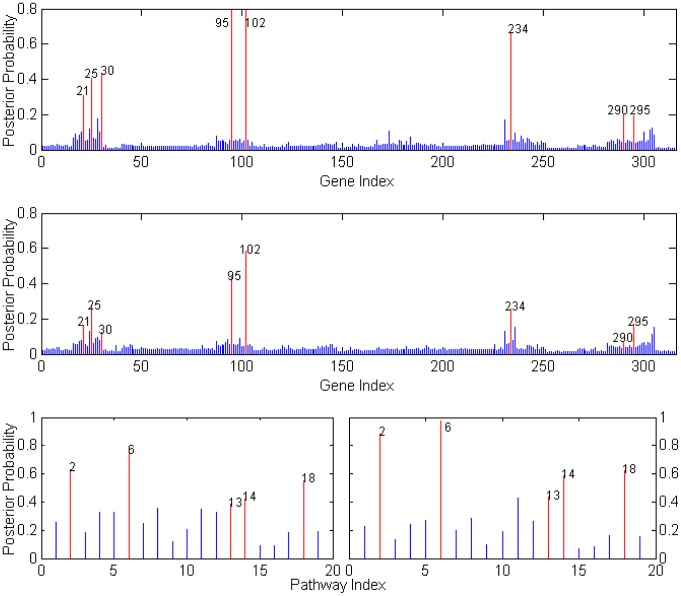
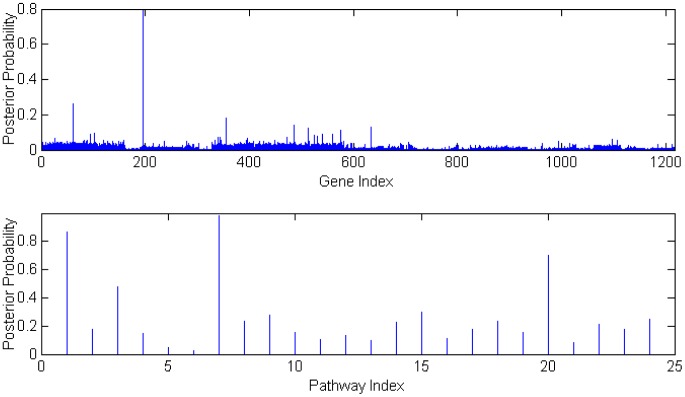
 , and second figure
  . The two smaller figures on the bottom demonstrate the posterior pathway selection probabilities, with the left one corresponding to
  , and right one
  . The labeled red lines indicate causal genes or causal pathways (those containing causal genes). These distributions were obtained by averaging over the 100 simulated sets of data.
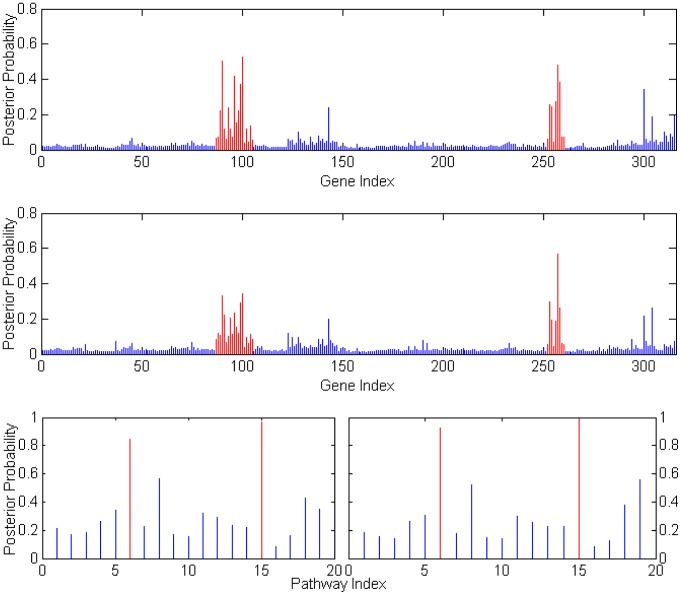
 , and second figure
  . The two smaller figures on the bottom demonstrate the posterior probabilities of pathway selection, with the left one corresponds to
  , and right one
  . The red lines indicate causal genes or causal pathways (those containing causal genes). These distributions were obtained by averaging over the 100 simulated sets of data.
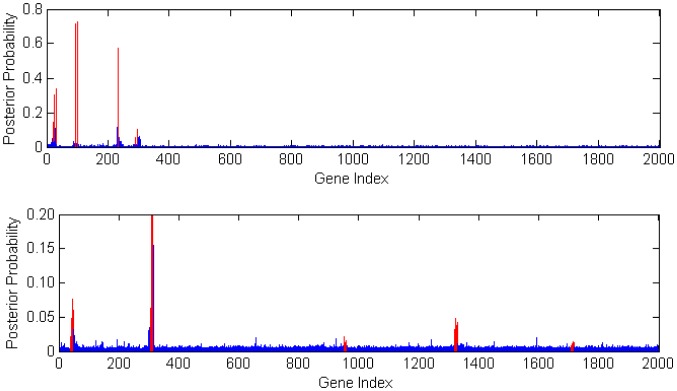
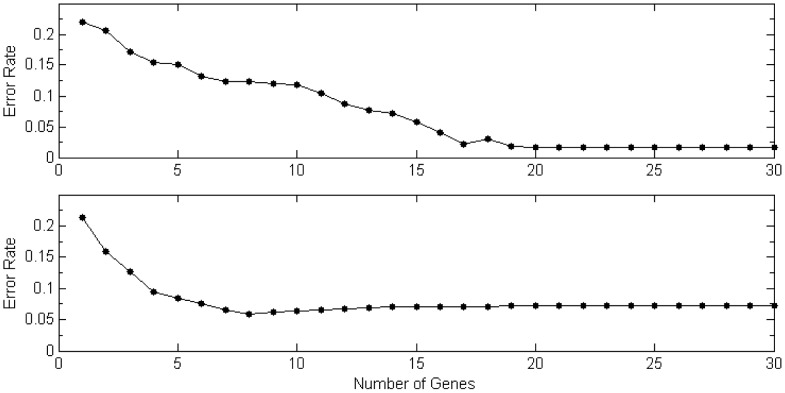
 . The top one is for
  and bottom one
  .
.
References
-
- Jain K (2009) Textbook of Personalized Medicine. Springer.
-
- Paik S, Shak S, Tang G, Kim C, Baker J, et al. (2004) A multigene assay to predict recurrence of tamoxifen-treated, node-negative breast cancer. New England Journal of Medicine 351: 2817–2826. - PubMed
-
- Mallick B, Gold D, Baladandayuthapani V (2009) Bayesian Analysis of Gene Expression Data, volume 130. John Wiley & Sons Inc.
-
- Guan Y, Stephens M (2011) Bayesian variable selection regression for genome-wide association studies and other large-scale problems. The Annals of Applied Statistics 5: 1780–1815.
-
- Golub T, Slonim D, Tamayo P, Huard C, Gaasenbeek M, et al. (1999) Molecular classification of cancer: class discovery and class prediction by gene expression monitoring. science 286: 531–537. - PubMed
Publication types
MeSH terms
Substances
Grants and funding
LinkOut - more resources
Full Text Sources
Other Literature Sources
