. 2013 Jul 3;8(7):e67792.
doi: 10.1371/journal.pone.0067792. Print 2013.

Evolution and allometry of calcaneal elongation in living and extinct primates

Affiliations

Evolution and allometry of calcaneal elongation in living and extinct primates

Doug M Boyer et al. PLoS One. .

Erratum in

  • PLoS One. 2013;8(9). doi:10.1371/annotation/77784e61-3a43-4615-85bd-b6b4369568fd

Abstract

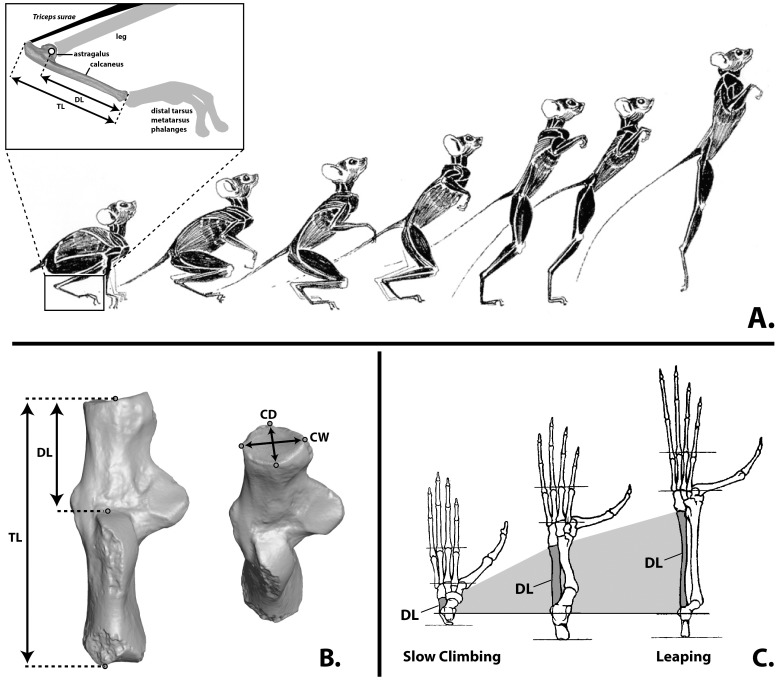
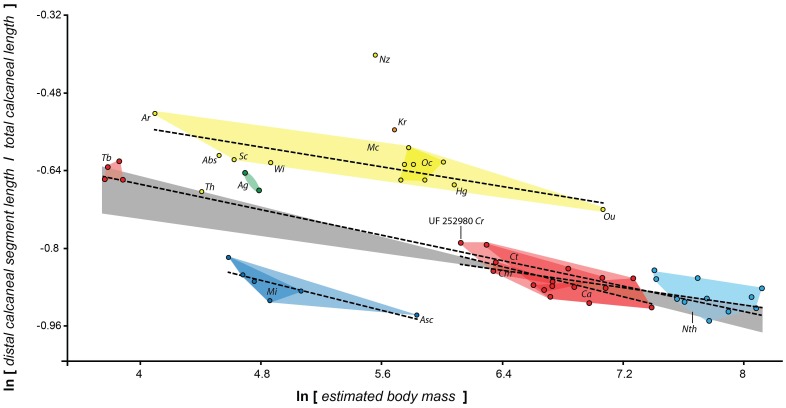
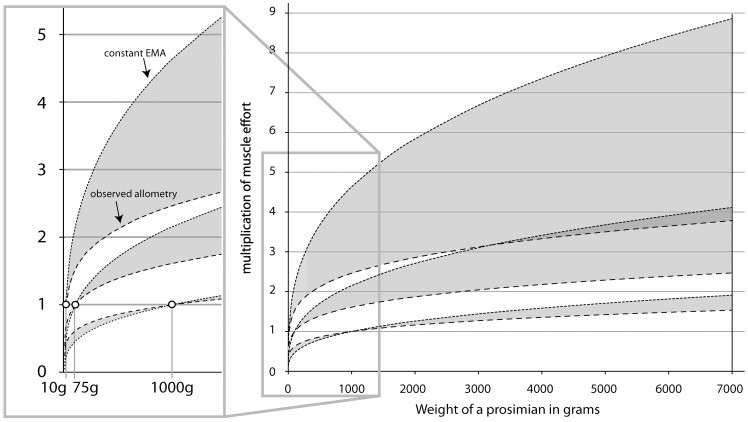
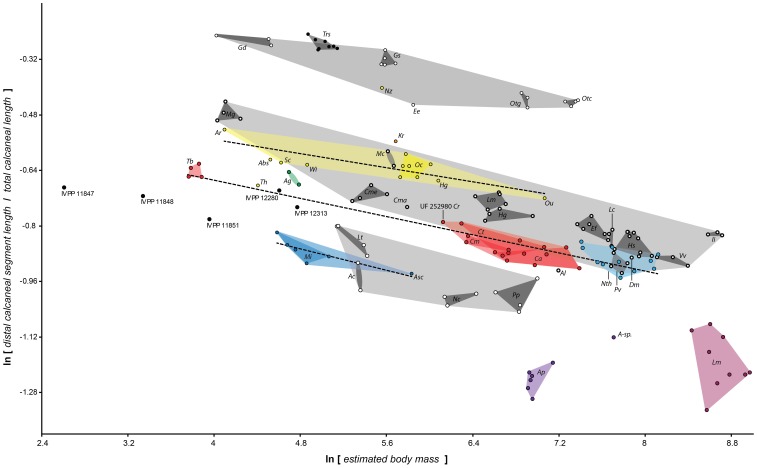
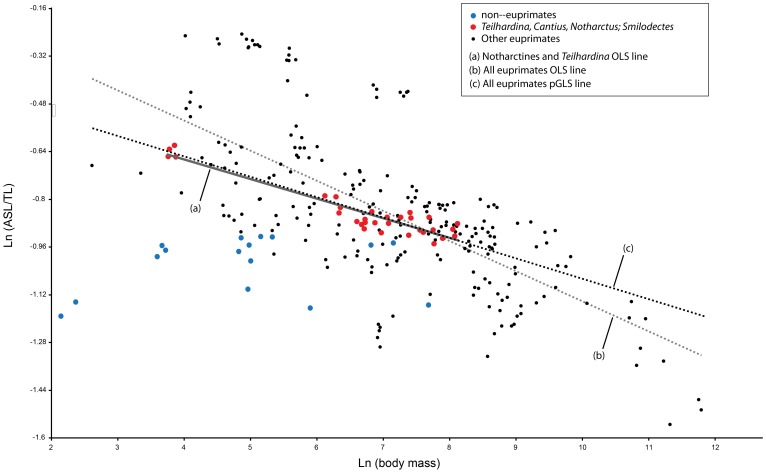
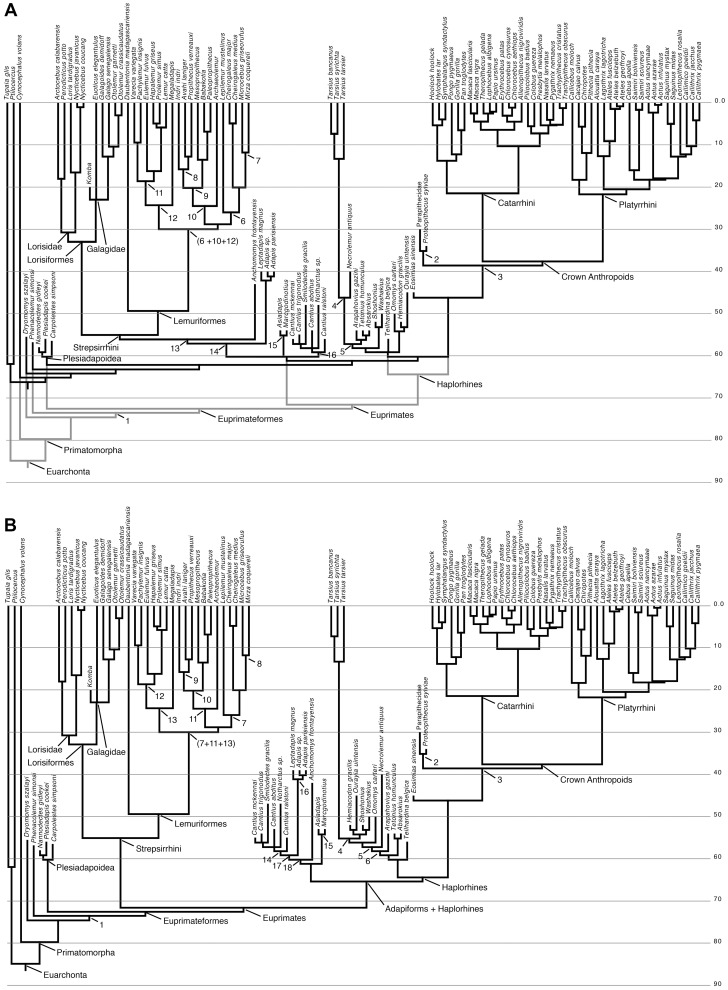
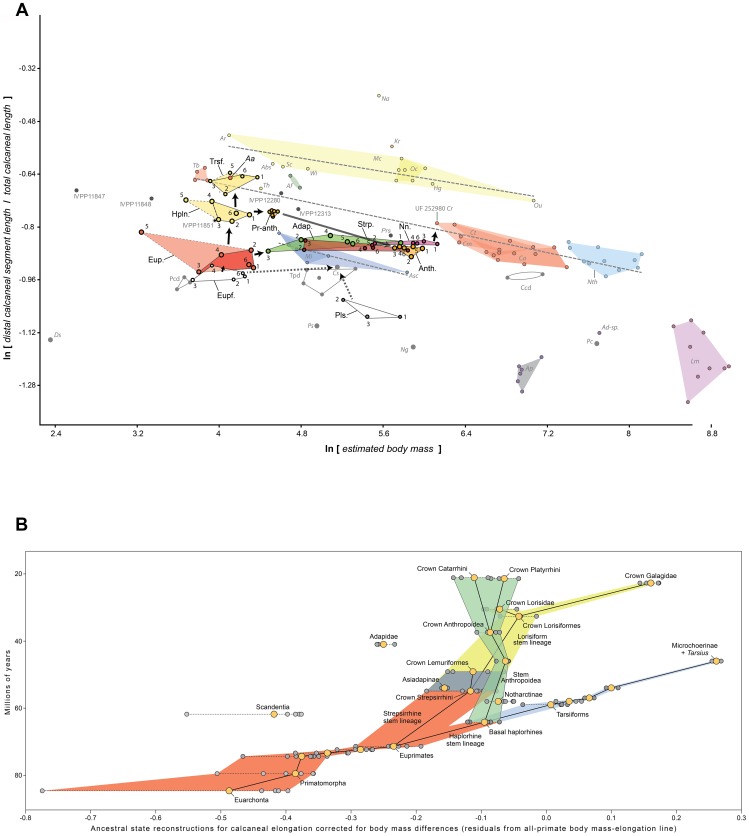
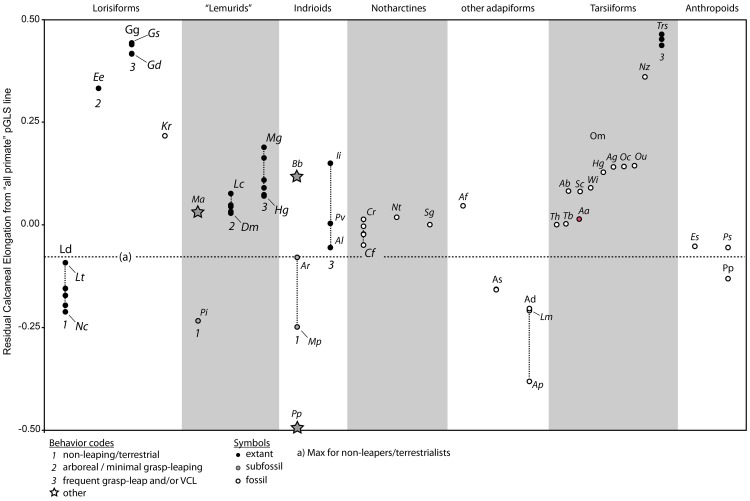
Specialized acrobatic leaping has been recognized as a key adaptive trait tied to the origin and subsequent radiation of euprimates based on its observed frequency in extant primates and inferred frequency in extinct early euprimates. Hypothesized skeletal correlates include elongated tarsal elements, which would be expected to aid leaping by allowing for increased rates and durations of propulsive acceleration at takeoff. Alternatively, authors of a recent study argued that pronounced distal calcaneal elongation of euprimates (compared to other mammalian taxa) was related primarily to specialized pedal grasping. Testing for correlations between calcaneal elongation and leaping versus grasping is complicated by body size differences and associated allometric affects. We re-assess allometric constraints on, and the functional significance of, calcaneal elongation using phylogenetic comparative methods, and present an evolutionary hypothesis for the evolution of calcaneal elongation in primates using a Bayesian approach to ancestral state reconstruction (ASR). Results show that among all primates, logged ratios of distal calcaneal length to total calcaneal length are inversely correlated with logged body mass proxies derived from the area of the calcaneal facet for the cuboid. Results from phylogenetic ANOVA on residuals from this allometric line suggest that deviations are explained by degree of leaping specialization in prosimians, but not anthropoids. Results from ASR suggest that non-allometric increases in calcaneal elongation began in the primate stem lineage and continued independently in haplorhines and strepsirrhines. Anthropoid and lorisid lineages show stasis and decreasing elongation, respectively. Initial increases in calcaneal elongation in primate evolution may be related to either development of hallucal-grasping or a combination of grasping and more specialized leaping behaviors. As has been previously suggested, subsequent increases in calcaneal elongation are likely adaptations for more effective acrobatic leaping, highlighting the importance of this behavior in early euprimate evolution.


Conflict of interest statement

Competing Interests: The authors have declared that no competing interests exist.

Figures

Figure 1
Figure 1. The biomechanical role of the ankle in leaping with a tarsifulcrumating foot.
A, Incremental stages in hind limb extension that accelerates the center of mass in a largely vertical direction in order to produce inertia that carries the animal through the air after the limbs are fully extended. The inset shows the relationship of distal segment (DL) of the calcaneus to the rest of the foot: it forms the “load arm” in a class 2 lever system. The lever arm (the heel) comprises the rest of the calcaneal length (TL). B, Measurements used in this study shown on a left calcaneus. Abbreviations: CD, cuboid facet depth; CW, cuboid facet width; TL, total proximodistal length; DL, distal segment length. C, Left feet of primates exhibiting different degrees of leaping specialization scaled to same metatarsus length and aligned at fulcrum of ankle. Taxa that never use leaping behavior have much shorter tarsal bones as shown on the left. The way in which differential degrees of leaping specialization and body-size interact to influence and complicate this relationship is debated .
Figure 2
Figure 2. Extant prosimian calcanei exhibit a diversity of sizes and proportions.
A, Almost all major prosimian genera are represented at the same scale. B, The same taxa are represented, scaled to length of the proximal segment and arranged (within familial groups) so that the smallest members are on the left, while the largest are on the right. This organization helps one visualize qualitatively, the allometric trends plotted in subsequent figures. Abbreviations: Ac, Arctocebus calabarensis; Al, Avahi laniger; Cma, Cheirogaleus major; Cme, Cheirogaleus medius; Dm, Daubentonia madagascariensis; Ee, Euoticus elegantulus; Ef, Eulemur fulvus; Em, Eulemur mongoz; Gd, Galagoides demidovii; Gs, Galago senegalensis; Hg, Hapalemur griseus; Hs, Hapalemur simus; Ii, Indri indri; Lc, Lemur catta; Lm, Lepilemur mustelinus; Lt, Loris tardigradus; Mc, Mirza coquereli; Mg, Microcebus griseorufus; Nc, Nycticebus coucang; Oc, Otolemur crassicaudatus; Og, Otolemur garnetti; Pp, Perodicticus potto; Pv, Propithecus verreauxi; Vv, Varecia variegata.
Figure 4
Figure 4. Plotting early fossil forms reveals allometric scaling within and between certain clades.
Different interecepts but similar slopes of scaling of distal calcaneal elongation index to body mass (as reconstructed from cuboid facet area) characterize different groups of early primates. There is a low- (based on Asiadapinae), intermediate- (based on all or subsets of the following taxa: Cantius, Notharctus, Smilodectes and Teilhardina) and high-elongation line (based on Omomyinae: see Table 2); see also Fig. 3B. The intermediate elongation line appears to be primitive, as the non-primate taxa plotting near the low line (some scandentians and plesiadapiforms) actually exhibit a non-significant relationship between mass and elongation. Dashed lines represent ordinary least squares lines for different groups. Adapiforms are represented by a line describing Cantius species only and one representing all notharctids. The gray area represents the space in between the mean for the two lines. Polygons: Red, Cantius and Teilhardina; Light blue, Notharctus; Dark blue, asiadapines; Yellow, Omomyines; Solid yellow, Omomys; Green, Anchomomys. Th, Tetonius homunculus. See Figure 3 caption for taxon abbreviations.
Figure 10
Figure 10. Modeling force magnification plot.
We modeled the biomechanical significance of the empirically demonstrated allometry by assessing the scaling of the relative force needed to balance the load and lever arms of the calcaneus for a primate of varying body mass. We modeled this with three different “ancestral sizes” 10 g, 75 g and 1,000 g. For each starting weight we modeled the increase in relative effort required by the m. triceps surae muscles attaching to the calcaneal tuber for size increase with a constant load arm/lever arm ratio (upper, thin-dashed lines) and with the expected allometric change in load arm/lever arm ratios (lower, thick-dashed lines). We plot values up to 7 kg, the weight of the largest extant prosimians, and show that the observed allometry reduces the effort multiplication required by the animals’ hindlimbs by as much as a 9-to−4 ratio. Note also that evolving to smaller body sizes yields a diminished effort for constant and allometrically changing load arm/lever arm ratios. This opens the possibility for evolving “off” the line when body size decreases, without incurring extra effort on the muscular system (see text).
Figure 5
Figure 5. Plot of fossils with extant forms imposed shows similar allometric scaling relationships characterize in living taxa.
To better understand the phenetic associations of the fossils and to help consider the functional implications of their proportions, we plot them with extant taxa. Each data point represents an individual. Dark gray polygons represent species groups. Light gray polygons bound different extant prosimian radiations: Upper polygon, Galagidae; middle polygon, lemuriformes; lower polygon, Lorisidae. (see Figures 2 and 3 for taxon abbreviations). “IVPP” specimens are eosimiids from Shanguang fissure fills with taxon identifications given in Gebo et al. (2000).
Figure 3
Figure 3. Relevant fossil calcanei exhibit a diversity of sizes and proportions.
A, All relevant euprimate fossil (but not subfossil) genera measured and analyzed in this study are depicted at the same scale. B, the same taxa are depicted scaled to proximal segment length. The row corresponds to the scaling relationship of the taxa while the left-right position corresponds to body size. Note the left specimens (smaller) have relatively longer calcanei than the right speciments (larger). Abbreviations and specimen numbers (with numbers applying left to right; “R” stands for “reversed”): Ac, Asiadapis cambayensis (GU 760); Mi, Marcgodinotius indicus (GU 709,710); Eosimias sinensis (IVPP 12313R,12280R,11851); Cr, Cantius ralstoni (UF 252980; UM 79150; UM SLC VC misc6; CAB12–0209); Cm, Cantius mckennai ((USGS 5897R); Ct, Cantius trigonodus (USGS 21829); Ca, Cantius abditus (USGS 6783R); Cfe, Copelemur feretutus (USGS 21828R); Cfr, Cantius frugivorus (USGS 21781R); Nz, Necrolemur zitteli (A/V 637); Ab, Absarokius sp. (UCM 67907R); Wi, Washakius indicus (AMNH 88824); Sc, Shoshonius cooperi (CM69765); Ar, Arapahovius gazini (UCM 67850R); Tb, Teilhardina belgica (IRSNB 16786–03R); Kr, Komba robustus (KNM-SO 1364); Ou, Ourayia uintensis (SDSN 4020–60933); Hg, Hemiacodon gracilis (AMNH 12613); Oc, Omomys carteri (UCM 67678); Sg, Smilodectes gracilis (AMNH 131766R, 131774); Nth, Notharctus tenebrosus. (AMNH 11474R, 129382R, 131763R, 13766); Ap, Adapis parisiensis (NMB QE741R, QE644R, QE779); A-sp, Adapis sp. NMB QE 530; Lm, Leptadapis magnus (NMB QF421R, QE830R, QW 1676, QE604).
Figure 6
Figure 6. Comparison of ordinary least squares (OLS) lines by plotting slopes and intercepts.
When using ordinary least squares, it is difficult to define a natural group to which to limit a sample for a scaling relationship. We dealt with this in several ways: 1) by starting with small (genus level) groups, and adding sister taxa until the slope and/or intercept of the line changed significantly, including the loss of a significant relationship. 2) For extinct taxa, we considered both phylogenetic proximity (not just monophyly). Our approach yielded a large number of regression equations (Table 2), which are difficult to compare with one another since changes in slope can be expected to yield changes in intercept. Therefore, we graphically compare the regression equation estimates by using slope of a relationship as the covariate and intercept as a dependent variable. This shows an expected relationship: more negative slopes have predictably higher intercepts. Fitting a line to this relationship we compare intercepts (or relative calcaneal elongation) as residuals from this line. This allows us to compare line position when methods like ANCOVA are not supported due to differing slopes of lines of interest. What can be seen is that parapithecids, asiadapines and lorisids have regression equations with the lowest residuals, Eocene taxa tend to have slightly negative residuals, lemuriforms have slightly positive residuals, omomyines have higher residuals, and galagos have the highest residuals. The tarsier relationship is non-significant (as is that for all gray points) so its position is not technically meaningful. However, the non-significant relationship for Tarsius appears mainly a result of small sample size (likely) given the high slope, in contrast to other non-significant relationships (“anaptomorphines,” scandentians, etc.) which have slopes close to zero. This plot presents data consistent with other ways of looking at body-size scaled levels of calcaneal elongation used in this study and suggests on average that early Eocene primates had lower levels of calcaneal elongation than extant lemuriforms.
Figure 7
Figure 7. Comparison of ordinary least squares (OLS) and phylogenetic generalized least squares lines fit to an “all primate” sample.
Adding data from all extant primate groups leads to a much steeper ordinary least squares regression slope (b) than given by analyzing smaller samples of closely related taxa (e.g., a). However, PGLS style regression using the caper package of R shows that phylogenetic autocorrelation of values has little affect for small samples of closely related taxa (low values of λ in Table 5) meaning that OLS and PGLS give nearly identical results. However, phylogenetic autocorrelation has a strong effect in larger samples (higher λ values in Table 5). The maximum likelihood PGLS regression equations for large samples (c) thus show a much different slope than the OLS equations for these samples. The PGLS slope and intercept are instead much closer to that for small samples.
Figure 8
Figure 8. Representative trees for ASR state reconstruction.
Part A shows trees 1 and 2 which differ in branch lengths towards the base of the tree only. Tree 1 has divergence dates for major extant clades set by molecular evidence. We institute minimum ghost lineages to incorporate fossils. Tree 2 has divergence dates set by fossil evidence when available such that the creation of ghost lineages is minimized even more. Node numbers of interest are given for reference with Table 8, and Figure 10. Part B represents tree 3 in which Eocene omomyiforms and adapids are treated as stem haplorhines , which we consider the most substantially different, yet potentially correct alternative hypothesis for euprimate relationships.
Figure 9
Figure 9. Plots of ancestral state reconstructions for nodes of interest in primate evolution.
A, Nodal transitions imposed on fossil morphospace. We plot ancestral state reconstructions (ASR) of body mass and Calcaneal Elongation index on the morphospace of real taxa to visualize the PGLS-inferred pattern of calcanaeal evolution in the transition from stem- to Euprimates. Colored polygons with numbered points represent ancestral reconstructions for a given clade among different trees (i.e., different numbers indicate different trees – see Tables S2–S7 in File S1; Fig. 8). Note that there is slight overlap in the polygons representing the realm of euprimateform ASRs and Euprimate ASRs. The trajectory of change from the plesiadapoid ASRs to Carpolestes simpsoni is important for this analysis: it corroborates the idea that increases in grasping capacity should be linked to increases in calcaneal elongation, as C. simpsoni differs from other plesiadapids in having more proficient grasping capabilities and greater calcaneal elongation, but no evidence of greater leaping proclivities, otherwise . Alternatively, if C. simpsoni is reconstructed as the sister taxon of euprimates (6), its position in the phylogeny is consistent with a basal trend of gradually increasing elongation relative to body mass. Regardless of tree used, the euprimate ancestor has lower elongation for its mass than any sampled taxon. This suggests parallel increases in early haplorhines and strepsirrhines coincidentally moved Teilhardina and Cantius onto the same regression line as defined by all euprimates. Non-allometric changes evolved through elongation at relatively constant body mass in haplorhines, and through increases in body mass, with only slight increases in elongation among strepsirrhines. B, Elongation residuals for ASRs relative to the “all euprimate” regression line (y = −0.068×+−0.39). Note this shows that despite different evolutionary trajectories of body mass and elongation change in early strepsirrhines and early haplorhines, both show similar changes in residual elongation relative to the “euprimate node.” Abbreviations: Aa, Archicebus achilles; Adap, Adapiform/ancestral strepsirrhine nodes; Anth, Anthropoid nodes; Eup, Euprimate nodes; Eupf, Euprimateform nodes; Hpln, Ancestral Haplorhine nodes; Pcd, Ptilocercidae; Tpd, Tupaiidae; Trsf, Tarsiiform nodes; Ccd, Cynocephalidae; Pr-anth, Protoanthropoid (including eosimiids) nodes; Nn, Notharctine nodes; Prs, Proteopithecus sylviae; see previous figures for other abbreviations.
Figure 11
Figure 11. Box plots of residual elongation.
We plot species mean values for residual elongation from the all primate line (Residual A from Table 1). The distribution of values within clades corresponds very well to degree of agility of locomotion. For fossils the variation corresponds with locomotor agility hypotheses based on additional skeletal features . When these residual data sets are examined with phylogenetic ANOVA, a strong relationship between elongation and behavior is revealed (Table 7) meaning that calcaneal elongation is broadly related to behavior in contrast to the conclusion of Moyà-Solà et al. . See previous figures for taxon abbreviations.

Similar articles

Cited by

References

    1. Le Gros Clark WE (1959) The Antecedents of Man. Edinburgh: Edinburgh University Press. 394 p.
    1. Cartmill M (1992) New views on primate origins. Evol Anthropol 1: 105–111. - PubMed
    1. Szalay FS, Dagosto M (1980) Locomotor adaptations as reflected on the humerus of Paleogene primates. Folia Primatol 34: 1–45. - PubMed
    1. Crompton RH (1995) “Visual predation,” habitat structure, and the ancestral primate niche. In: Alterman L, Doyle GA, Izard MK, editors. Creatures of the Dark: The Nocturnal Prosimians. New York: Plenum Press. 11–30.
    1. Napier JR, Walker AC (1967) Vertical clinging and leaping - a newly recognized category of primate locomotion. Folia Primatol 6: 204–219. - PubMed

Publication types