. 2013 Jul 3;8(7):e68159.
doi: 10.1371/journal.pone.0068159. Print 2013.

Anti-aggregating effect of the naturally occurring dipeptide carnosine on aβ1-42 fibril formation

Affiliations

Anti-aggregating effect of the naturally occurring dipeptide carnosine on aβ1-42 fibril formation

Alessandra Aloisi et al. PLoS One. .

Abstract

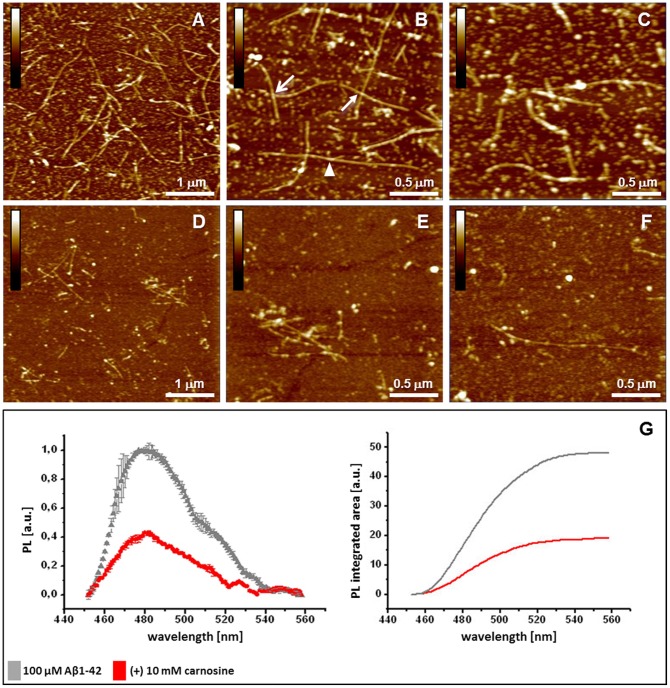
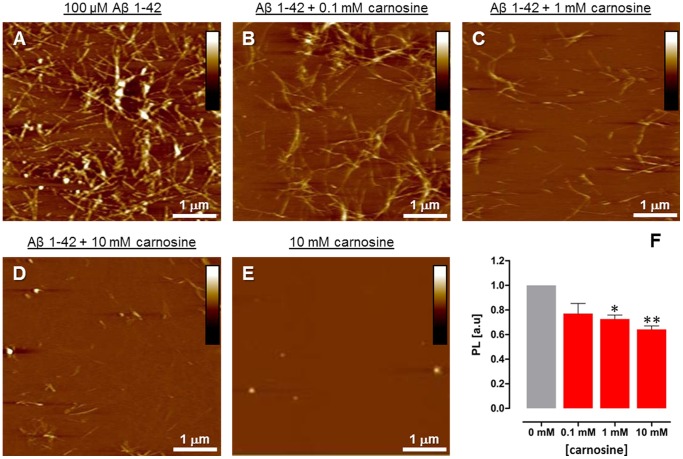
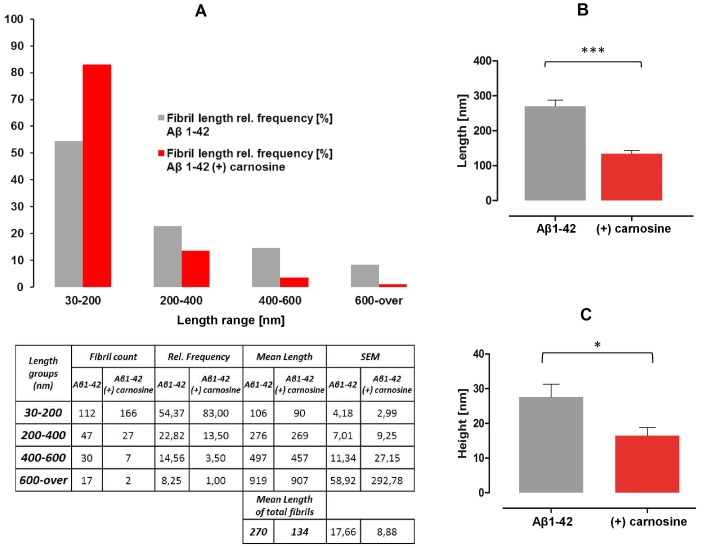
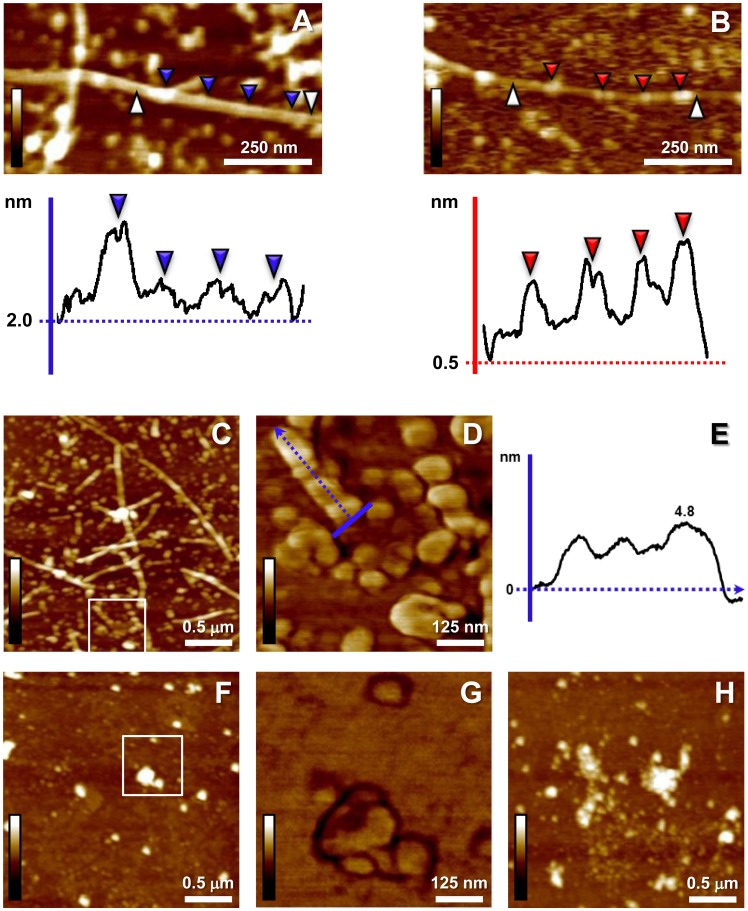
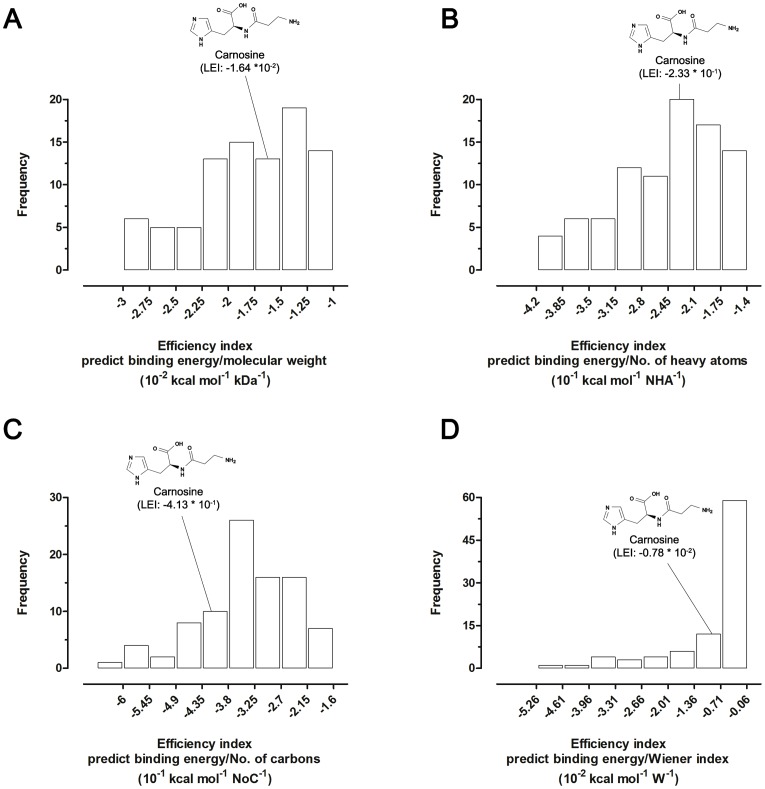
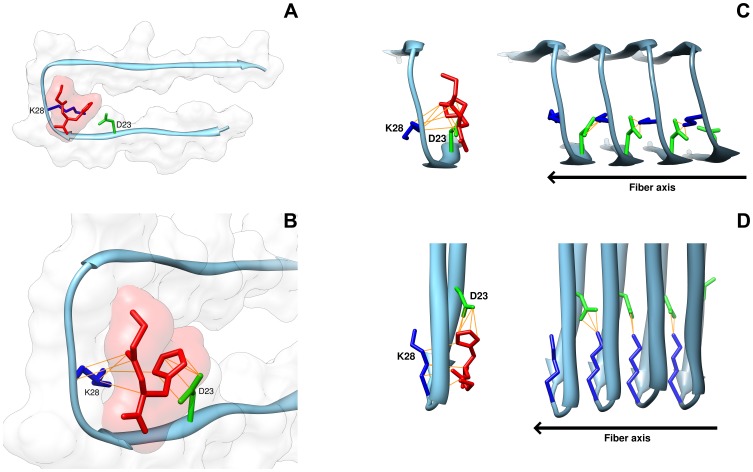
Carnosine is an endogenous dipeptide abundant in the central nervous system, where by acting as intracellular pH buffering molecule, Zn/Cu ion chelator, antioxidant and anti-crosslinking agent, it exerts a well-recognized multi-protective homeostatic function for neuronal and non-neuronal cells. Carnosine seems to counteract proteotoxicity and protein accumulation in neurodegenerative conditions, such as Alzheimer's Disease (AD). However, its direct impact on the dynamics of AD-related fibril formation remains uninvestigated. We considered the effects of carnosine on the formation of fibrils/aggregates of the amyloidogenic peptide fragment Aβ1-42, a major hallmark of AD injury. Atomic force microscopy and thioflavin T assays showed inhibition of Aβ1-42 fibrillogenesis in vitro and differences in the aggregation state of Aβ1-42 small pre-fibrillar structures (monomers and small oligomers) in the presence of carnosine. in silico molecular docking supported the experimental data, calculating possible conformational carnosine/Aβ1-42 interactions. Overall, our results suggest an effective role of carnosine against Aβ1-42 aggregation.


Conflict of interest statement

Competing Interests: The authors have declared that no competing interests exist.

Figures

Figure 1
Figure 1. Effects of carnosine on Aβ1-42 fibrillogenesis.
Analysis of the deposited amyloid aggregates as assessed by Atomic Force Microscopy (AFM) and thioflavin T (ThT) assays. AFM pictures (AF) represent a comparative view of deposited Aβ1-42 amyloid aggregates, with representative fibrils from (A–C) Aβ1-42 samples (control) and (D–F) Aβ1-42/carnosine co-incubated samples. (B, C) Higher resolution images of (A) are reported, showing (B) extended structures of linear branched (arrowhead), overlapped (closed arrow) or associated (open arrow) fibrils; small fibrillar formations and oligomers among globular particles are also observed. (E, F) Higher resolution images of (D) are reported, showing spare fibrils and aggregates with respect to what observed in Aβ1-42 samples; conspicuous fibril segmentation and size reduction were observed [Height mode imaging; Pico Force type scanner; scanned area size: 5×5 µm in (A) and (D) and 2.5×2.5 µm in the others; height bars colour code: 0.0 nm, total black, 15 nm, total white]. (G) Quantitative effects of carnosine on Aβ1-42 fibrillogenesis by ThT assay. Data are expressed as ThT photoluminescence (PL; Y axis) values (means ± SD, n = 3) in solutions of Aβ1-42 (100 µM) incubated for 30 min in the absence (control) and presence of carnosine (10 mM). In the left graph, the maximum photoluminescence intensity (near wavelength 480 nm; X axis) is reduced in the co-incubated samples (red circles) with respect to the samples containing Aβ1-42 alone (grey triangles), passing from 1.0 to ∼ 0.4 absorbance units (a.u.). The emission spectrum of carnosine alone was subtracted, and emission data of peptide dispersions were normalized. In the graph on the right: fluorescence signals expressed as the integrated areas under the curves (OriginPro 8).
Figure 2
Figure 2. Dose-dependent effects of carnosine on Aβ1-42 fibrillogenesis.
Analysis of the deposited amyloid aggregates as assessed by Atomic Force Microscopy (AFM) and thioflavin T (ThT) assays. AFM pictures (A–D) represent a view of deposited Aβ1-42 amyloid aggregates, with representative fibrils from Aβ1-42 samples (A; control) and Aβ1-42 samples incubated with 0.1 mM (B), 1 mM (C) and 10 mM (D) carnosine. AFM picture (E) of 10 mM carnosine alone. [Height mode imaging; Pico Force type scanner; scanned area size: 5×5 µm; height bars colour code: 0.0 nm, total black, 30 nm, total white]. (F) Quantitative effects of increasing concentrations of carnosine on Aβ1-42 fibrillogenesis by ThT assay. Data are represented as ThT photoluminescence (PL) values (means ± S.E.M., n = 3) in solutions of Aβ1-42 (100 µM) incubated for 30 min in the absence (control, 0 mM carnosine) and presence of 0.1, 1 and 10 mM carnosine. The photoluminescence intensity at 480 nm is reduced in the co-incubated samples in a dose-dependent manner with respect to the samples containing Aβ1-42 alone, passing from 1.0 to 0.64±0.03 absorbance units (a.u.). The emission value of carnosine alone was subtracted, and data were normalized with respect to the control (Aβ1-42 alone, 0 mM carnosine). (** p<0.01; * p<0.05; one-way ANOVA analysis of variance of the means; Bonferroni post-hoc test).
Figure 3
Figure 3. Effects of carnosine on Aβ1-42 fibril morphology: length and height analysis of deposited aggregates.
(A) The fibril contour length distributions were calculated based on Atomic Force Microscopy measurements (grey and red bars refer to absence and presence of carnosine, respectively). Fibril sizes are grouped by length range (nm), while length distributions are reported as relative (%) frequency groups of the total number of measurements (n = 206 for Aβ1-42 and n = 202 for carnosine co-incubated samples; see table related to figure A for statistical details). (B) The mean values of the total fibril length measurements are reported for fibrils detected in the absence (grey bars) or presence (red bars) of carnosine (*** p<0.0001; unpaired t test). (C) Height digital data were obtained by scanning areas of 5×5 µm from Aβ1-42 alone (grey bars) and carnosine co-incubated samples (red bars), using the Nanoscope Software 7.3 roughness routine (* p<0.05; n = 5; unpaired t test).
Figure 4
Figure 4. Effects of carnosine on Aβ1-42 fibrillogenesis: structural changes of fibrils and morphology of sub-fibrillar aggregates.
(A) Magnification of a representative fibril from a control sample (from Figure 1B ; 100 µM Aβ1-42). The related graphic panel reports the surface profile of a selected segment (white arrowheads, from left to right). A regular structure periodicity is shown, with relative height homogeneity among different pointed regions (blue arrowheads), except in protrusion (or interacting) sites (first blue arrowhead, left); for the fibril surface structure, a baseline height of 2 nm from substrate level is reported. (B) The profile of the selected segment (white arrowheads, from left to right) from a digitally zoomed sporadic fibril from carnosine (10 mM) co-incubated samples shows tangled pattern, irregular vertical height from the baseline (0.5 nm), and alternation between beaded regions (red arrowheads) and tubular segments (height bars colour code in A, B: 0.0 nm, total black, 10.0 nm, total white; Height mode imaging; Nanoscope 7.3 Section Analysis tool with no flatten filter applied). (C) Higher resolution scansion of Aβ1-42 fibrils in the absence of carnosine: aggregates of reduced size (protofibrillar/oligomeric formations, globular particles) are detected among fibrils. (D) Higher magnification (Phase signal; white square inset from C) shows pre-fibrillar organization of the amyloid structures as ordered rows with constant and homogeneous topographic profile along the axis (blue arrow in D indicates the profile direction reported in E). (F) Magnifications of carnosine co-incubated samples do not show similar ordered patterns of the sub-fibrillar dispersed aggregates (G, Phase mode imaging, white square inset from F); aggregates show size heterogeneity and less regular shape. (H) Quasi-spherical and decorated aggregates are typically visible in the carnosine co-incubation. Imaging from C to H performed with E type scanner; specific scan sizes: 2.5×2.5 µm in C, F, H and 0.625×0.625 µm in D, G; height bars colour code: 0.0 nm, total black, 15.0 nm, total white.
Figure 5
Figure 5. Frequency distributions of ligand efficiency indices (LEIs).
LEIs were obtained by using the Autodock Vina predicted binding free energies calculated for carnosine, carnosine-like dipeptides and natural or synthetic anti-amyloid aggregation compounds vs Aβ1-42. Relative positions of the carnosine score in the distribution graphs were indicated. The same number of bins were applied for all the histograms. (A) Molecular weight-based efficiency index (free energy of binding/MW). (B) Number of heavy atoms-based efficiency index (free energy of binding/NHA). (C) Number of carbons-based efficiency index (free energy of binding/NoC). (D) Wiener index-based efficiency index (free energy of binding/W).
Figure 6
Figure 6. Three-dimensional model of interactions of carnosine with the fibril of the Aβ1-42 peptide.
Binding mode of carnosine with the fibril structure of Aβ1-42 (PDB Acc. no. 2BEG) was obtained using Autodock Vina and visualized by UCSF Chimera software. (A) The carnosine dipeptide interacts with the fibril monomer of Aβ1-42 at the level of the coiled region between the two β-sheet portions of the Aβ1-42 peptide. The fibril monomer is represented by tube, and the secondary structure is reported colored in sky-blue; the dipeptide is depicted by tube colored in red. (B) Direct binding contacts (yellow lines) occur between the imidazole ring of L-histidine in carnosine and residue D23 (green) of Aβ1-42, and between the β-alanine end of carnosine and amino acid K28 (blue) of Aβ1-42. Surface renditions of the binding interface of carnosine and amyloid peptide are shown. (C) The self-association process of Aβ1-42 is inhibited by carnosine. The interaction of carnosine with the Aβ1-42 monomer prevents the direct binding of the D23 of a monomer with the K28 of the adjacent monomer in the growing Aβ1-42 oligomer. The elongation/growth direction of Aβ1-42 aggregation is reported as fiber axis. (D) A 90° clockwise rotation view (around the fiber axis) of the of Aβ1-42 self-association model inhibited by carnosine.

References

    1. Hipkiss AR (2009) Carnosine and its possible roles in nutrition and health. Adv Food Nutr Res 57: 87–154. - PubMed
    1. Hoffmann AM, Bakardjiev A, Bauer K (1996) Carnosine-synthesis in cultures of rat glial cells is restricted to oligodendrocytes and carnosine uptake to astrocytes. Neurosci Lett 215: 29–32. - PubMed
    1. De Marchis S, Melcangi RC, Modena C, Cavaretta I, Peretto P, et al. (1997) Identification of the glial cell types containing carnosine-related peptides in the rat brain. Neurosci Lett 237: 37–40. - PubMed
    1. Bakardjiev A (1998) Carnosine and beta-alanine release is stimulated by glutamatergic receptors in cultured rat oligodendrocytes. Glia 24: 346–351. - PubMed
    1. Bakardjiev A, Bauer K (2000) Biosynthesis, release, and uptake of carnosine in primary cultures. Biochemistry (Mosc) 65: 779–782. - PubMed

Publication types

Associated data