. 2013 Jul 2;8(7):e68161.
doi: 10.1371/journal.pone.0068161. Print 2013.

Development of low phytate rice by RNAi mediated seed-specific silencing of inositol 1,3,4,5,6-pentakisphosphate 2-kinase gene (IPK1)

Affiliations

Development of low phytate rice by RNAi mediated seed-specific silencing of inositol 1,3,4,5,6-pentakisphosphate 2-kinase gene (IPK1)

Nusrat Ali et al. PLoS One. .

Abstract

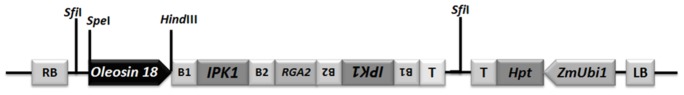
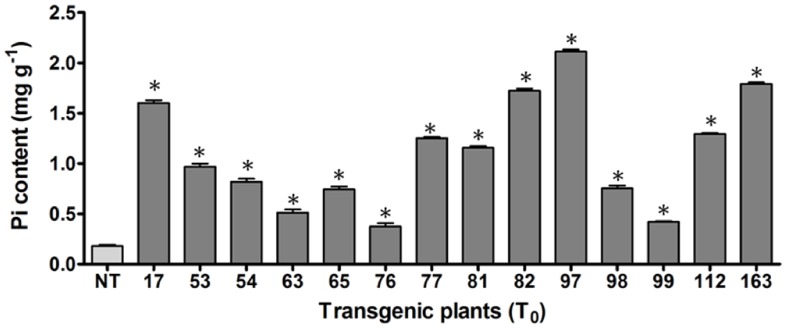
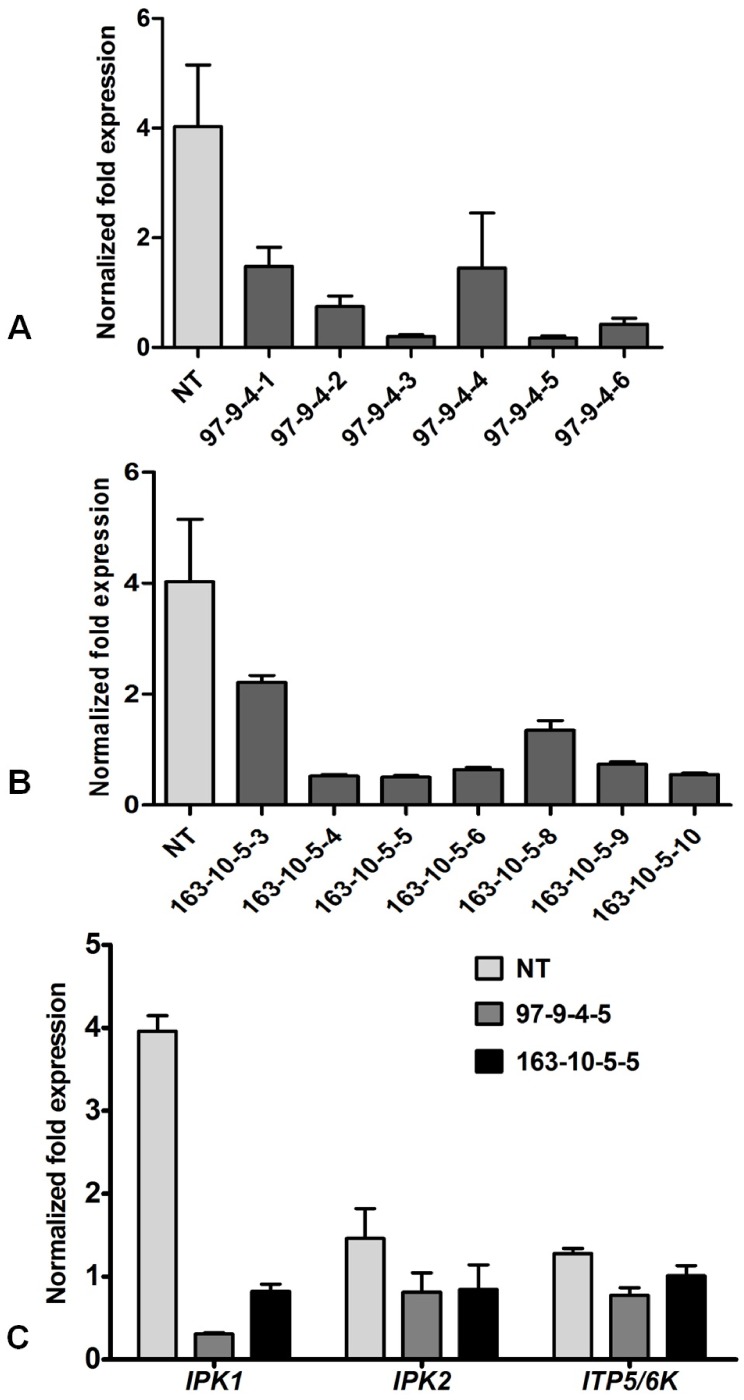
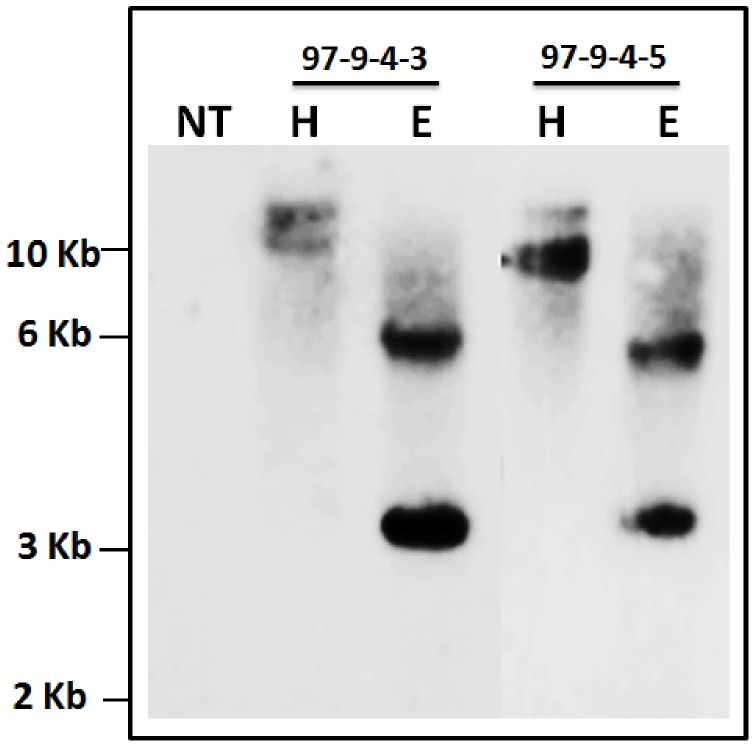
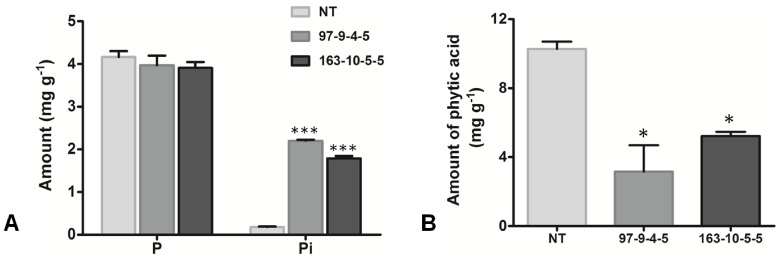
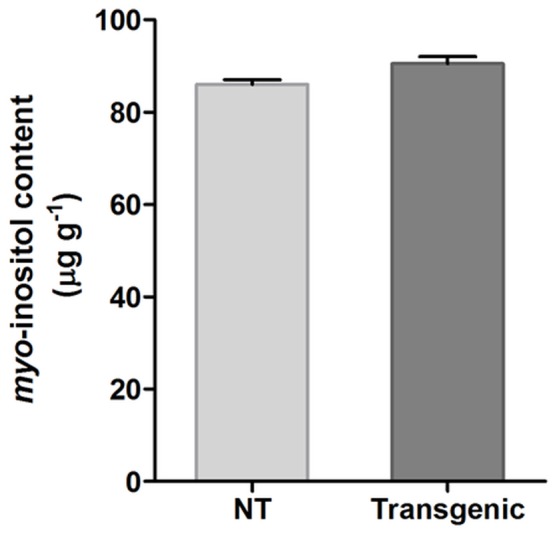
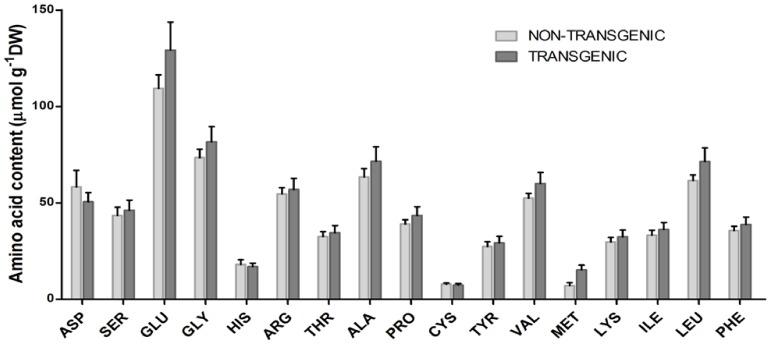
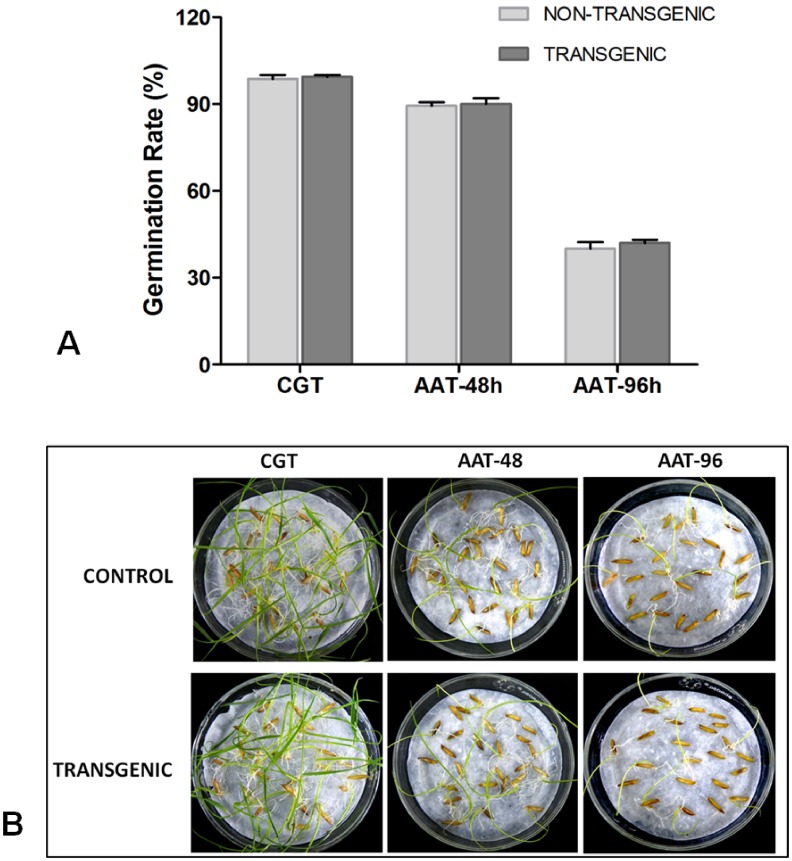
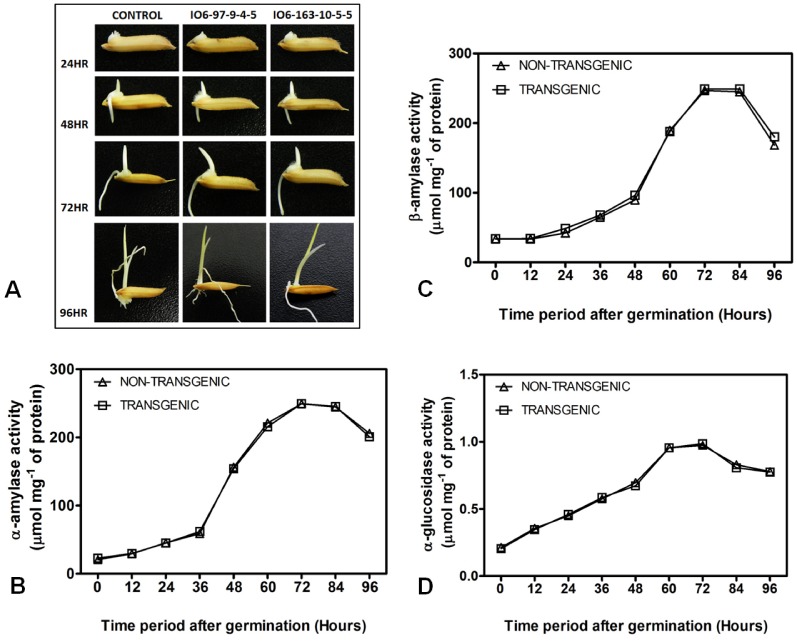
Phytic acid (InsP(6)) is considered to be the major source of phosphorus and inositol phosphates in most cereal grains. However, InsP(6) is not utilized efficiently by monogastric animals due to lack of phytase enzyme. Furthermore, due to its ability to chelate mineral cations, phytic acid is considered to be an antinutrient that renders these minerals unavailable for absorption. In view of these facts, reducing the phytic acid content in cereal grains is a desired goal for the genetic improvement of several crops. In the present study, we report the RNAi-mediated seed-specific silencing (using the Oleosin18 promoter) of the IPK1 gene, which catalyzes the last step of phytic acid biosynthesis in rice. The presence of the transgene cassette in the resulting transgenic plants was confirmed by molecular analysis, indicating the stable integration of the transgene. The subsequent T4 transgenic seeds revealed 3.85-fold down-regulation in IPK1 transcripts, which correlated to a significant reduction in phytate levels and a concomitant increase in the amount of inorganic phosphate (Pi). The low-phytate rice seeds also accumulated 1.8-fold more iron in the endosperm due to the decreased phytic acid levels. No negative effects were observed on seed germination or in any of the agronomic traits examined. The results provide evidence that silencing of IPK1 gene can mediate a substantial reduction in seed phytate levels without hampering the growth and development of transgenic rice plants.


Conflict of interest statement

Competing Interests: The authors have declared that no competing interests exist.

Figures

Figure 1
Figure 1. Schematic diagram showing partial map of RNAi vector construct.
pOle18-IPK1-006 vector construct showing the IPK1 gene cloned in sense and antisense orientation separated by wheat RGA2 intron. HPT gene was used as the plant selection marker. (T = CaMV 35S terminator).
Figure 2
Figure 2. Screening of transgenic plants based on inorganic phosphate (Pi) content.
Pi fractions in non-transgenic (NT) and T0 transgenic rice plants were analyzed from the seeds. The symbol * indicates significant differences at P = 0.05 (n = 3).
Figure 3
Figure 3. Expression analysis of transgenic rice plants.
qRT-PCR analysis of T4 transgenic seeds of (A) IO6-97-9-4 and (B) IO6-163-10-5, as compared to the internal control β tubulin reveals down-regulation in the transcript level of IPK1. The normalized fold expression clearly indicates varied level of silencing, the maximum reduction being 3.85-fold as observed in 97-9-4-5. (C) Expression levels of IPK1, IPK2 and ITP5/6K genes in selected RNAi transgenic lines IO6-97-9-4-5 and IO6-163-10-5-5. (NT = Non-transgenic control).
Figure 4
Figure 4. Southern blot analysis of T4 progenies of line IO6-97.
Stable integration of RGA2 intron was detected in transgenic rice plants, no hybridization signal was observed in the respective non-transgenic control. Each lane consists of 10 µg genomic DNA, digested with EcoRI or HindIII. The position and sizes of markers are indicated (NT = Non-transgenic control, E = EcoRI and H = HindIII).
Figure 5
Figure 5. Analysis of Phosphorus and phytic acid content in the transgenic rice seeds.
(A) Total phosphorus and Pi content in non-transgenic (NT) and T4 low phytate transgenic seeds and (B) amount of phytic acid in non-transgenic (NT) as compared to T4 transgenic seeds. The symbols * and *** indicates significant differences at P = 0.05 and 0.001 respectively (n = 3).
Figure 6
Figure 6. Effect of IPK1 silencing on seed myo-inositol content.
Myo-inositol content of T4 transgenic seeds (IO6-97-9-4-5) as compared to non-transgenic (NT) seeds showed no significant difference (P≥0.05).
Figure 7
Figure 7. Amino acid analysis in mature grains of non-transgenic and T4 transgenic plants.
Diagram representing the individual amino acid content of non-transgenic and the transgenic rice grains calculated with respect to the amino acid standard. The error bars indicate SE of three biological replicates for each sample. The data represented here for the transgenics is averaged from the observations of both IO6-97-9-4-5 and IO6-163-10-5-5.
Figure 8
Figure 8. Analysis of seed germination potential in non-transgenic and T4 transgenic low phytate seeds.
(A) Rate of germination as observed during control germination test (CGT) and accelerated ageing test (AAT) in both non-transgenic and the transgenic rice seeds. (B) Picture showing the morphology of transgenic seeds with respect to the non-transgenic control as recorded at 8th day of germination during the CGT and AAT.
Figure 9
Figure 9. Enzyme activity analysis during germination in T4 transgenic and non-transgenic control seeds.
(A) Picture showing the phenotype of the seeds during the course of germination at different time intervals. (B) α-amylase, (C) β-amylase and (D) α-glucosidase enzyme activity analyzed at different time intervals after germination in non-transgenic and the transgenic seeds showing no significant differences (P≥0.05). The open triangles represent response of non-transgenic (NT) and opened squares represent response of transgenics. (The data represented here for the transgenics is averaged from the observations of both IO6-97-9-4-5 and IO6-163-10-5-5).

References

    1. Raboy V, Gerbasi PF, Young KA, Stoneberg SD, Pickett SG, et al. (2000) Origin and seed phenotype of maize low phytic acid 1–1 and low phytic acid 2–1. Plant Physiol 124: 355–368. - PMC - PubMed
    1. Holm PB, Kristiansen KN, Pedersen HB (2002) Transgenic approaches in commonly consumed cereals to improve iron and zinc content and bioavailability. J Nutr 132: 514–516. - PubMed
    1. Kuwano M, Ohyama A, Tanaka Y, Mimura T, Takaiwa F, et al. (2006) Molecular breeding for transgenic rice with low phytic acid phenotype through manipulating myo inositol 3 phosphate synthase gene. Mol Breeding 18: 263–272.
    1. Raboy V (2009) Approaches and challenges to engineering seed phytate and total phosphorus. Plant Sci 177: 281–296.
    1. Lucca P, Hurrell R, Potrykus I (2001) Genetic engineering approaches to improve the bioavailability and the level of iron in rice grains. Theor Appl Genet 102: 392–397.

Publication types

MeSH terms