

Transient exposure to low levels of insecticide affects metabolic networks of honeybee larvae
- PMID: 23844170
- PMCID: PMC3699529
- DOI: 10.1371/journal.pone.0068191
Transient exposure to low levels of insecticide affects metabolic networks of honeybee larvae
Abstract
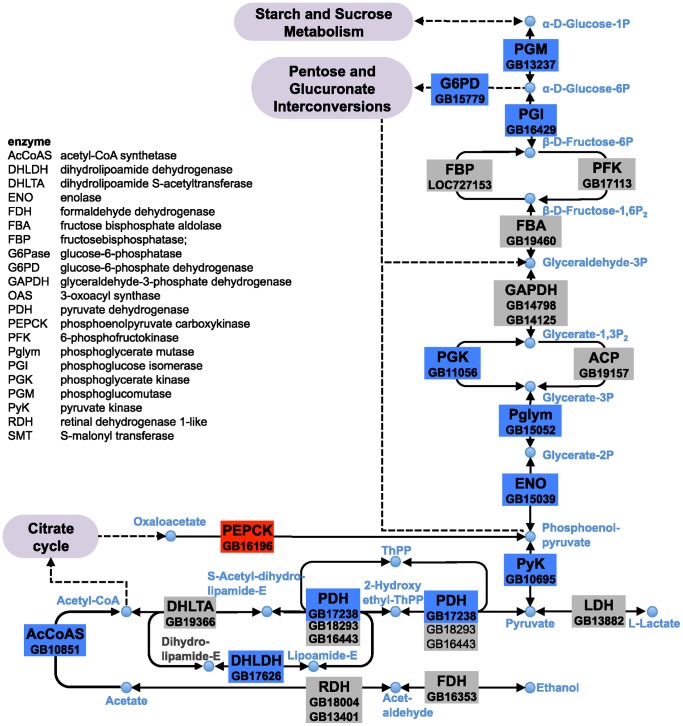
The survival of a species depends on its capacity to adjust to changing environmental conditions, and new stressors. Such new, anthropogenic stressors include the neonicotinoid class of crop-protecting agents, which have been implicated in the population declines of pollinating insects, including honeybees (Apis mellifera). The low-dose effects of these compounds on larval development and physiological responses have remained largely unknown. Over a period of 15 days, we provided syrup tainted with low levels (2 µg/L(-1)) of the neonicotinoid insecticide imidacloprid to beehives located in the field. We measured transcript levels by RNA sequencing and established lipid profiles using liquid chromatography coupled with mass spectrometry from worker-bee larvae of imidacloprid-exposed (IE) and unexposed, control (C) hives. Within a catalogue of 300 differentially expressed transcripts in larvae from IE hives, we detect significant enrichment of genes functioning in lipid-carbohydrate-mitochondrial metabolic networks. Myc-involved transcriptional response to exposure of this neonicotinoid is indicated by overrepresentation of E-box elements in the promoter regions of genes with altered expression. RNA levels for a cluster of genes encoding detoxifying P450 enzymes are elevated, with coordinated downregulation of genes in glycolytic and sugar-metabolising pathways. Expression of the environmentally responsive Hsp90 gene is also reduced, suggesting diminished buffering and stability of the developmental program. The multifaceted, physiological response described here may be of importance to our general understanding of pollinator health. Muscles, for instance, work at high glycolytic rates and flight performance could be impacted should low levels of this evolutionarily novel stressor likewise induce downregulation of energy metabolising genes in adult pollinators.
Conflict of interest statement
Figures


Similar articles
-
The effect of temperature on candidate gene expression in the brain of honey bee Apis mellifera (Hymenoptera: Apidae) workers exposed to neonicotinoid imidacloprid.J Therm Biol. 2020 Oct;93:102696. doi: 10.1016/j.jtherbio.2020.102696. Epub 2020 Aug 15. J Therm Biol. 2020. PMID: 33077117
-
Imidacloprid-induced impairment of mushroom bodies and behavior of the native stingless bee Melipona quadrifasciata anthidioides.PLoS One. 2012;7(6):e38406. doi: 10.1371/journal.pone.0038406. Epub 2012 Jun 4. PLoS One. 2012. PMID: 22675559 Free PMC article.
-
Stress indicator gene expression profiles, colony dynamics and tissue development of honey bees exposed to sub-lethal doses of imidacloprid in laboratory and field experiments.PLoS One. 2017 Feb 9;12(2):e0171529. doi: 10.1371/journal.pone.0171529. eCollection 2017. PLoS One. 2017. PMID: 28182641 Free PMC article.
-
Transcriptome analyses of the honeybee response to Nosema ceranae and insecticides.PLoS One. 2014 Mar 19;9(3):e91686. doi: 10.1371/journal.pone.0091686. eCollection 2014. PLoS One. 2014. PMID: 24646894 Free PMC article.
-
Sperm viability and gene expression in honey bee queens (Apis mellifera) following exposure to the neonicotinoid insecticide imidacloprid and the organophosphate acaricide coumaphos.J Insect Physiol. 2016 Jun;89:1-8. doi: 10.1016/j.jinsphys.2016.03.004. Epub 2016 Mar 12. J Insect Physiol. 2016. PMID: 26979384
Cited by
-
Compound and Dose-Dependent Effects of Two Neonicotinoid Pesticides on Honey Bee (Apis mellifera) Metabolic Physiology.Insects. 2019 Jan 8;10(1):18. doi: 10.3390/insects10010018. Insects. 2019. PMID: 30626039 Free PMC article.
-
Comparative analyses of the effects of sublethal doses of emamectin benzoate and tetrachlorantraniliprole on the gut microbiota of Spodoptera frugiperda (Lepidoptera: Noctuidae).J Insect Sci. 2023 Jul 1;23(4):7. doi: 10.1093/jisesa/iead039. J Insect Sci. 2023. PMID: 37471131 Free PMC article.
-
Comparative transcriptomics indicates endogenous differences in detoxification capacity after formic acid treatment between honey bees and varroa mites.Sci Rep. 2020 Dec 14;10(1):21943. doi: 10.1038/s41598-020-79057-9. Sci Rep. 2020. PMID: 33318550 Free PMC article.
-
Honeybee colonies compensate for pesticide-induced effects on royal jelly composition and brood survival with increased brood production.Sci Rep. 2021 Jan 8;11(1):62. doi: 10.1038/s41598-020-79660-w. Sci Rep. 2021. PMID: 33420177 Free PMC article.
-
Exposure to Temperature and Insecticides Modulates the Expression of Small Noncoding RNA-Associated Transcripts in the Colorado Potato Beetle, Leptinotarsa decemlineata (Coleoptera: Chrysomelidae).J Insect Sci. 2022 Jan 1;22(1):23. doi: 10.1093/jisesa/ieac004. J Insect Sci. 2022. PMID: 35172010 Free PMC article.
References
Publication types
MeSH terms
Substances
LinkOut - more resources
Full Text Sources
Other Literature Sources
